I live in the USA and I am concerned about the future. I created this blog to share my thoughts on the economy and anything else that might catch my attention.
This is the End and a New Beginning
-
I've been thinking about this for some time.
After 21 years of writing this blog almost daily, I've decided to stop
writing the daily updates on the blog.
...
Silver Deep Dive
-
Silver had a memorable year (+148%). Some of this can be explained by a
decline in the dollar. I decided to do some ML analysis to look for other
insights....
Housing prices nationally and in Metro Detroit continued to rebound in June from housing crisis lows, according to a leading measure of the U.S. real estate market released today...
The tax credit is equal to 10 percent of the home’s purchase price up to a maximum of $8,000.
It's actually a trick question. 10% of $7,500 is only $750. If you wanted the full $8,000 tax credit, you would have needed to do what Detroit's population has done since the 1950s. Find somewhere else to live. Sorry.
Allowing the overall deflation in the U.S. in the 1930s and Japan in the 1990s was one quite fixable policy error.
Japan's deflation has actually been extremely modest from 1993 to 2010 (as seenhere). I'd say we're giving them a very good run for the money so far. Pun intended.
For those of us who had been worried about deflation, that offers some reassurance that things may not be quite as desperate as we feared.
Worried about deflation? Weren't we told not to worry? Wasn't it impossible? Yep. I'm rereading that part at the top again. So where did all this desperation and fear come from?
I'm not saying this particular VAR is the definitive word in how to model inflation, but I think it indicates the fact that based upon historical correlations, there is ample evidence to support the view that deflation is very possible.
From impossible to very possible in just two years does not a good trend make! In fact, it tends to make me paranoid.
Make a joke and I will sigh and you will laugh and I will cry
What's going on? Why is it peaking like that and seemingly heading down into the abyss? It is starting to look like what happened to farming and manufacturing jobs when technology and outsourcing appeared.
Not to be alarmist, but if the percentage was at 1962 levels then there would be an additional 5 million people unemployed.
The process of delving into the black abyss is to me the keenest form of fascination. - H. P. Lovecraft
Don't worry. Based on today's stock market activity, I was simply looking for any excuse to quote Lovecraft. That's all.
All right. Move On. Nothing to see here. Please disperse. Nothing to see here. Please.
We doubt that any single or simple story can explain the movement in house prices, especially over the past decade. While our analysis indicates that one plausible explanation of that boom, easy credit conditions – and low interest rates alone – cannot account for most of what happened to prices, we are not able to offer a compelling alternative hypothesis.
What a joke. They cannot see what interest rates did and they cannot offer an alternative hypothesis either? Seriously? Consider the following chart.
I used a very simplistic "What do you want your monthly payments to be" computer model. Does that not do an adequate job of explaining what happened? The chart shows what happens when wages rise (in nominal terms). That allows housing prices to rise. It also shows what happens when interest rates fall. That also allows housing prices to rise, since lower rates lead to lower monthly payments. It's atwo-fer!
How can anyone possibly think that falling interest rates were not the primary factor in creating the housing boom? The #1 reason I turned bearish in 2004 is because I was receiving ZERO PERCENT mortgage offers in the mail. Why can't some economists figure that out? Are they locked away safely within their ivory towers?
So what went wrong? Let me repeat what I said in 2009.
It is a "what do you want your payments to be" problem. Since housing prices were rising faster than overall inflation, housing prices were also rising faster than the cost to build the homes. Thanks to capitalism, that meant that more and more homes would be built. Eventually, there were just too many homes and everyone started to realize it. Oops! At that point, it stopped being a "what do you want your payments to be" problem and became a "how do I unload my home before it tanks to its true value" problem, or should have been anyway.
Need more proof? Let's see if we can spot "more and more homes" being built. Yes. There they are in the following chart being built and being sold. That's twice as many as is typical. Oops!
How hard is this to understand? Just look at the feeding frenzy that falling interest rates created. Many economists can't even seem to figure it out in hindsight though.
Some participants believed that the prolonged period of policy accommodation had generated a significant degree of liquidity that might be contributing to signs of potentially excessive risk-taking in financial markets evidenced by quite narrow credit spreads, a pickup in initial public offerings, an upturn in mergers and acquisition activity, and anecdotal reports that speculative demands were becoming apparent in the markets for single-family homes and condominiums.
Duh!!
The only economics class I have ever taken was Economics 101 in college. It was the most skipped class in all of my college experience. I only showed up once a week to take the simple test. No joke. Apparently I did not miss much.
You may think I'm being too hard on economists. I don't think I am. If you ask two physicists where a cannon ball will hit based on the initial force of the explosion and the angle of inclination of the cannon, most would probably come up with a rather decent estimate. Physics is funny that way.
In sharp contrast, we still can't get all the economists to agree that falling interest rates were a major factor in the housing boom, even though the Fed itself saw the same risks I did in 2004.
Biggs echoed remarks by famed fund manager George Soros, who said last week he thinks the next incident of global turmoil is likely to hit closer to home because of what he sees as a dangerous "asset bubble" in the U.S.
The best growth-stock strategy? Buy a well-diversified mutual fund, Siegel said.
The chart above shows the trading volume on the Nasdaq. The exponential trend is based on data up to and including the Nasdaq's peak price of 5,048.62 achieved on March 10, 2000. Like all unchecked exponential growth, it was eventually doomed to failure.
The chart above shows the deviation from the long-term exponential trading volume trend. I've included all 4 higher order polynomial trends to show just how dead that trend had become.
Mr Soros said he believed the US housing bubble, a major factor behind strong American consumption, had reached its peak and was in the process of being deflated.
But Siegel says he's become more and more optimistic in recent weeks.
``The big fear that the economy is totally falling out of bed . . . I don't think that's going to materialize," he said.
The chart above shows new home sales. The exponential trend is based on the sales volume data from the low median selling price reached in 1989 to the high median selling price reached in 2007. As is seen in the chart, that trend was not sustainable nor was it even backwards compatible.
The chart above shows the deviation from the long-term exponential sales volume trend. I've once again included all 4 higher order polynomial trends to show just how dead that trend had become.
March 1 (Bloomberg) -- George Soros is helping drive up gold prices by doubling his bet in a market even he considers a “bubble” as Goldman Sachs Group Inc., Barclays Capital and HSBC Holdings Plc predict more gains before it bursts.
The chart above shows the trading volume in GLD. The exponential trend is based on the trading volume data from the fund's inception in 2004 to its record high price set in June. The concern for gold bugs here is that the trading volume is no longer following the exponential trend line.
The chart above shows the deviation from the long-term exponential trading volume trend. I've included all 4 higher order polynomial trends to show that the trend may be starting to roll over.
The filings show that Soros continued to hold a large stake in gold. His firm held a total of 5.6 million shares of the SPDR Gold Trust (GLD.P) worth almost $607 million at the end of the quarter. Soros owned 6.2 million shares of the gold exchange-traded fund worth $663 million at the end of 2009.
The fund firm said it owned 5.24 million shares of the SPDR Gold Trust (GLD.P) worth $638 million as of June 30. Though down slightly from the fund's 5.59 million shares owned at the end of the first quarter, that was the fund's biggest holding by dollar value.
Soros told the world that gold was the ultimate bubble early this year. As seen above, he sold 15% of his GLD holdings over the last two quarters and unloaded his U.S. equities.
The chart above shows the trading volume in TLT. The exponential trend is based on the trading volume data from the fund's inception in 2002 to its record high price set in 2008. The concern here is that the bond market sees something Jeremy Siegel does not.
The chart above shows the deviation from the long-term exponential trading volume trend. I've included all 4 higher order polynomial trends to show that the trend may actually be starting to gather steam.
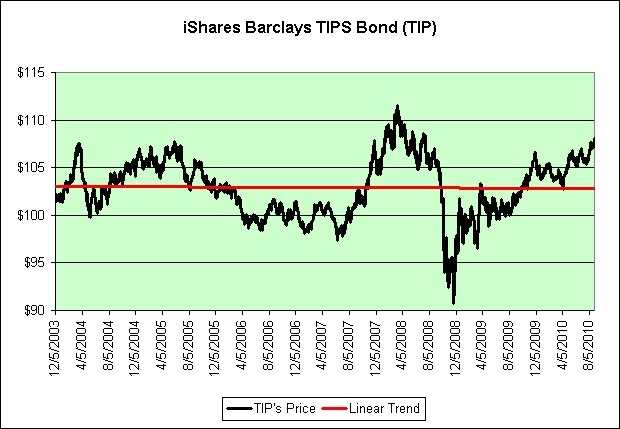
Hello deflationary mess? If so, we might be able to see it in the trading volumes of TIP. The inflation protected treasury bond fund was dragged down when the stock market crashed in 2008. On the off chance it repeats, Imoved my IRA to casha few days ago. I didn't feel the rewards for holding it through this Christmas season were worth the risks.
The chart above shows the trading volume in TIP. The exponential trend is based on the trading volume data from the fund's inception in 2003 to its record high price set in 2008.
The chart above shows the deviation from the long-term exponential trading volume trend. I've included all 4 higher order polynomial trends to show that like gold, the volume of trading in the inflation protected treasury bond fund may be starting to roll over.
It may not roll over though. Who really knows? I certainly don't think it is in a bubble. Part of the increased volume was due to the sell-off during the last deflationary event. That said, TIP is not exactly cheap right now. It's been rising in price on generally low volume and for what I think are the wrong reasons. Should we experience another deflationary event, TIP would be especially prone for a fall.
This chart surprises me a bit. The increasingly noisy data still generates a perfectly flat trend line. Age of Turbulence?
The first major trip below the trend was when the stock market was rising rapidly from 2005 to 2007. Money flowed out of safe assets and into riskier assets.
The second major trip below the trend line was when the stock market was falling rapidly in late 2008. Money flowed out of inflation protected assets and into deflation protected assets.
It's been a day since Isold TIPin my IRA. So far, so good.
JACKSON, Wyo. (AP) -- Federal Reserve Chairman Ben Bernanke said Friday that the Fed will consider making another large-scale purchase of securities if the slowing economy were to deteriorate significantly and signs of deflation were to flare.
I just want to make sure I understand this correctly. If signs of deflation were to flare and the investing public decided to pour into long-term treasuries for safety and potential profits, then Federal Reserve Chairman Ben Bernanke would consider piling into them too? That's good to know.
As a leader, part of your job is to inspire the people around you to push themselves - and, in turn, the company - to greatness. To do this, you must show them the way by doing it yourself.
One wonders if the Federal Reserve would also consider selling their stocks, cutting back on trips to the malls, postponing new car purchases, and perhaps even brown bagging their lunches. You know, if deflation sets in.
Monday Perks: Mondays can be vicious. On Sunday, be good to yourself by packing a cloth or decorative paper napkin, pretty paper plate, colorful plastic tableware. If you do this on Mondays only, they make it even more special. Or get a variety of designer paper products and mix and match during the week.
We chose a parabola to depict the situation of debt issuers because debt gets exponentially harder to repay or refinance as the interest rate rises, especially for large debtors. So problems tend to intensify exponentially the higher up the curve one goes -- just as the angle of a parabola's ascent grows steeper.
1937: Negative real interest rates fail to prevent another round of economic contraction.
I mentioned something similarhere. Negative real interest rates failed to provide the desired effects twice so far. We're currently working on attempt #3.
However, there is a problem with the Fed’s data set and, therefore, with its conclusion. The Fed’s selected time frame does not include any deflationary periods, which makes it a less-than-robust model (that is, one that won't work in all economic environments). In fact, it’s reminiscent of the models used to price mortgage-backed securities. You know, the ones that didn’t bother to consider what might happen if house prices fell. So, if the inputs fail to include all scenarios, when an unexpected scenario hits, the conclusions are likely to be as wrong as AAA subprime ratings.
Bearish since 2004. Just moved to all cash inmy IRAand plan to keep it that way unless serious bargains appear. I've never done that before. It's a first. I'm also sitting on much more cash than normal outside of my IRA.
Yes, we have seen a large rise in most indicators from the depths of despair in early 2009. That does not tell us very much. Massive stimulus launched a V-shaped recovery despite the debt burden hanging over the economy. Perma-bears have always argued that this was built on unstable foundations, and would tip over as government stimulus fades.
We will find out over the next three or four months whether they are right.
Without any easy options left, Bernanke must try to prevent another recession by persuading people and businesses to feel confident enough about the future to spend more today.
"There's no economy! Um, well, I mean... to go bust of course."
A particularly important protective factor in the current environment is the strength of our financial system: Despite the adverse shocks of the past year, our banking system remains healthy and well-regulated, and firm and household balance sheets are for the most part in good shape.
Be sure to refresh your memory of his thoughts of Japan. In hindsight, it is quite a read.
The claim that deflation can be ended by sufficiently strong action has no doubt led you to wonder, if that is the case, why has Japan not ended its deflation?
...
First, as you know, Japan's economy faces some significant barriers to growth besides deflation, including massive financial problems in the banking and corporate sectors and a large overhang of government debt.
Shocking. Good thing that's not happening here.
Second, and more important, I believe that, when all is said and done, the failure to end deflation in Japan does not necessarily reflect any technical infeasibility of achieving that goal.
It doesn't necessarily reflect that. It might reflect that. It might not. Nobody really knows.
In the resulting political deadlock, strong policy actions are discouraged, and cooperation among policymakers is difficult to achieve.
No deadlock here. Everyone is completely on the same page about what to do next. 100% unanimous agreement.
WASHINGTON—The Aug. 10 meeting of top Federal Reserve officials was among the most contentious in Ben Bernanke's four-and-a-half year tenure as central bank chairman.
There’s not much more help coming from Washington, analysts said. Congress appears deadlocked on economic policy until at least the November election, while the Federal Reserve, which has cut its key interest rate to near zero, appears limited in what else it can do to spark the economy.
My IRA sits entirely in cash right now. It is earning a whopping 0.1% annual interest in an FDIC insured bank account.
I expect it to be a losing trade. However...
It's not whether you're right or wrong that's important, but how much money you make when you're right and how much you lose when you're wrong. - George Soros
I don't think there is much upside left for TIP. The 5-Year TIPS are hovering just above 0% and inflationary pressures have been very tame since I turned deflationary in November.
There's a lot of downside in TIP though, as seen in2008. TIP's median price since inception is $102.99. Since it pays out all inflationary gains and interest in distributions, all things being equal it should hover around that value over the long-term. All things aren't equal though so who really knows?
There are at least two ways real yields could revert to the mean. There's the bullish case that the economy improves and money flows back out of bonds and into stocks. There's the bearish case that the economy deteriorates into a deflationary mess. This really isn't a bullish or a bearish call to me.
That said, I do not think TIP is in a bubble. I just think that the upside reward is not worth the downside risk. I already own plenty of TIPS and I-Bonds outside of my retirement account. I do not feel the need to be "all in" right now. Reducing my TIPS exposure within my retirement account was the easiest way to do it.
So-called negative real interest rates represent an emergency strategy by Chairman Ben S. Bernanke and are fraught with risks. The central bank would be skewing incentives toward spending, away from saving, typically leading to asset booms and busts that have to be dealt with later.
In hindsight, "later" turned out to be that very summer, as the oil bubble popped.
The Fed tried to keep the Fed Funds rate below inflation for much of the past decade, just like they did in the stagflationary 1970s. As seen in the chart, they failed twice though. Other than housing that popped in 2006, the stock market that popped in 2007, and commodities that popped in 2008, does anyone see any other bubbles forming? Or reforming? Stocks? Oil? China's real estate?
We could also look for something special. Something that might have risen 400% over the last decade and was also popular in the 1970s. Something continuously seen in TV advertisements. Something that historically tracked inflation but thensuddenly outpaced it. Something far more precious to us thanaluminum, and at any price. Gold?
I should point out that one way the Fed could fail a third time is if we simply slide into deflation. That would certainly push the low Fed Fund's rate into positive real territory, again.
But which comes first? The chicken or the egg? If everyone flees risky assets simultaneously then deflation will arrive and prove that everyone should have fled risky assets simultaneously. I guess that means that the chicken would come first. The nest egg would just be left behind. Or... maybe nobody panics. It's just a theory.
It is also possible that I'm just seeing bubbles where they don't exist. Maybe there's a"veritable bubble in bubbles".
Didier Sornette, who studies bubbles and is a professor at the Swiss Federal Institute of Technology, says low-interest-rate, low-return environments, where everyone is looking for safe havens (sound familiar?), are perfect for new investment manias.
I went into this article expecting to get in a good sarcastic heckle or two.
So why am I considering them? They are sold at half their face value. In 20 years they are guaranteed to double to their face value. In other words, if you hold them the full 20 years you are guaranteed 3.526% per year.
They now pay the same as 30-Year Treasuries, but you only have to hold them 20 years.
In sharp contrast to 30-Year Treasuries, if interest rates were to shoot up dramatically in the next few years then you could simply cash them out and walk away. Little harm done.
The only harm done would be that you'd have only earned 1.4% per year instead of the 3.5% you had hoped (you only get double if you hold the full 20 years). Further, you'd be taking a three month interest penalty hit (just 0.35%).
There's no hurry on the decision. The 1.4% rate is good through October. It will depend a lot on what interest rates do between now and then. If interest rates fall, then I will probably be buying these savings bonds. If interest rates rise, then I probably won't be.
The fixed rate is determined by adjusting the market yields of the 10-year Treasury Note by the value of components unique to savings bonds, including early redemption and tax deferral options.
Rates haven't just fallen on the 10-Year Treasury Note, they've plummeted. Unless things change between now and the end of October, I'll be a buyer.
The chart above shows the price of oil since hitting the bottom on December 23, 2008. I turned deflationary on November 9, 2009. The price of oil was $79.44. According toBloomberg, it is now $71.20. So far, so good. That's a 10% drop.
Please don't read too much into the trend line. I do not believe that I can predict the future price of something simply by looking into the past. You probably shouldn't either.
I'm just making a silly prediction based on my current deflationary outlook, the "unexpected" success of recent cartoon physics economic models (see link below), and my expectations of a Christmas season as "unexpectedly" weak as today'sunexpectedly weak housing report. That's all.
I am making no bets on the price of oil. I continue to sit in inflation protected treasuries and I-Bonds. All I care about is maintaining purchasing power. If deflation does strike, I plan to just ride it out again.
In meetings with analysts, new Caterpillar (NYSE: CAT) CEO Doug Oberhelman made extraordinarily bullish comments. Not only does he not see a double-dip recession happening, he sees signs of renewed vigor stirring in the economy and robust growth for Caterpillar.
Extraordinarily bullish comments and renewed vigor stirring in the economy notwithstanding, I think I shall pass at these prices.
For the sake of Caterpillar investors, let's hope there isn't a monumental property bubble and/or fixed-asset investment bubble in China.
During its first centuries of existence, the Republic of Haven was one of the most prosperous human worlds in the galaxy...
In 1700 PD, the Republic was renamed the People's Republic of Haven and used a kind of deceit that transformed the poor sections of society into a welfare state, in which citizens were entitled to a specified standard of living adjusted for inflation known as a Basic Living Stipend.
The economy of Haven was very fragile, and to help stabilize the economy, the government kept a constant state of warfare and conquests.
The legal currency of Haven (throughout all its changes of government) was the Havenite credit.
Two centuries of deficit spending had wrecked Haven's economy to the point that the Legislaturists and the Dolist Managers were unable to fix the problem...
Fortunately, that's just a work of science fiction. It could never happen here!
The first book ofDavid Weber'sHonor Harrington series, published in 1993, can be read free here. That's a substantial discount to the price I paid. Isn't deflation wonderful?
This reviewclosely matches my own thoughts on the series.
The DJIA is trading at roughly the same level that it was trading at when I turned bearish in 2004. That was my primary fear in 2004. It would simply stagnate. That's my primary fear now.
My long-term prediction is therefore just about as simplistic as simplistic could be. Hello stagnation. It's just a gut call. I don't have much supporting evidence to back it up. Just add one part deflation to one part stagflation and that's what you get though.
August 22, 2010
Lookin' good! Sigh.
This is considered to be Greenspan'sAge of Turbulence. Anything can happen next. He should know. He helped get us here!
Former Federal Reserve Chairman Alan Greenspan said the slowing economic recovery in the U.S. feels like a “quasi- recession” and the economy might contract again if home prices decline.
Really? A drop in home prices can cause the economy to contract? Who would have guessed? Perhaps I'll remain deflationary for a while longer then.
Myth: The crisis resembles the one that hit the U.S. savings and loan industry two decades ago, necessitating a multibillion-dollar government bailout.
Myth: The blame for the bubble in the housing market rests with former U.S. Federal Reserve Chairman Alan Greenspan, who kept interest rates too low for too long.
Myth: Because the current slowdown is due to the sharp cutback in the willingness of financial firms to lend, central banks can do little to improve the situation.
Reality: Banks wouldn't lend in1992. The banks wouldn't lend in2009.
Myth: Since almost all stock markets went up and down in unison during this crisis, international diversification is no longer an effective strategy for investors.
Certainly over the past few years there was much foolish lending that had led to severe losses, and the economy will suffer in the short run. But actions by central banks will assure that this credit crisis does not morph into a full-blown recession or worse. And in the long run, saner lending and more reasonable home prices will lead to a stronger economic recovery.
Most economists base much of their understanding of the economy on average and median income, savings, and debt data. Our very own Ben Bernanke looks to this type of data as seen in the Federal Reserve's Flow of Funds reports. There's just so much data to look at and the only way it seems even remotely manageable is to average it and summarize it.
I am now going to point out how this type of data can effectively hide problems within the economy and thereby confuse and shock mainstream economists as things fall apart. This is especially true when the problems start in subprime loans and are expected to remain there. The average person doesn't even have a subprime loan, right?
Consider the following two hypothetical economic situations. They are based on an economy with just three workers (which I have named "A", "B", and "C").
As seen through the eyes of "average" and "median" data, both situations are 100% identical. I would ask you these questions though.
1. Which situation is more unstable? 2. Which situation would be hurt most by rising oil prices? 3. Which situation would see payday loan stores become a growth industry?
I would argue that the economy as a whole is in far worse shape under situation #1 than it is under situation #2.
Deflation may be unlikely, but if it occurred, the consequences could be dire, and not just because of the direct economic impact. It would make dollars worth even more in the future, magnifying the U.S. government's surging debt burden. That could be the unspoken fear behind all that nervous talk.
There's nothing quite like an unspoken fear to generate plenty of hype. As we all know, the unspokenword of mouthcan spread like wildfire.
The following chart shows the Dow Jones Industrial Average adjusted for inflation (July 2010 dollars). It does not include dividends.
Click to enlarge.
The data is plotted on a log chart so that constant exponential growth is seen as a straight line.
It is an enhancement of achartthat I created about 6 years ago. That one wasn't adjusted for inflation but offered similar results.
The exponential trend line in green uses the low in June 1932 and the low in July 1982. The exponential trend line in yellow uses all of the data. The exponential trend line in red uses the high in August 1929 and the high in December 1999.
As a side note, I think the yellow line probably deserves to be parallel to the red and green lines. It's being tilted higher by our recent bubbles. I'm not adjusting for it though. I'm simply pointing it out.
Here's what the data looks like on a linear chart.
Click to enlarge.
Here are my conclusions.
If nothing has changed and we can assume all three long-term trends are therefore still in place then...
1. The average inflation adjusted fair value was 9,461 in July. 2. The potential downside risk was 3,106 in July. 3. The potential upside reward was 17,663 in July.
Let's assume that 9.5% unemployment, the lack of job creation for a full decade, and trillion dollar deficits don't constitute changes. They are just bumps in the road so to speak. Would it still seem rational to think that the DJIA would be trading above its average long-term fair value though?
What if things havechanged? What if it really is different this time? Then what?
I'm retired. I exited the stock market in 2004 at levels slightly above today's levels. I have no desire to come back unless I see a suitable bargain that can reward me for the risk I'd be taking. As seen in the chart, the lows of 2009 were clearly not sufficient to lure me back. They weren't even close to the green line. Today's levels have no chance.
I labeled Jim Cramer's advice back in May as a "Sarcasm FAIL". In hindsight, that was completely unacceptable. I apologize for underestimating the sheer size of the failure.
Given the new consumer optimism, good luck to anyone who wants to short this sector.
Here's an update to the stocks mentioned in the article.
Nordstrom: -28% Sears: -50% Guess: -17% J. Crew: -30% Gap: -31% Polo Ralph Lauren: -10% Coach: -13% Macy's: -12% Jones Apparel: -26% Tiffany: -12%
Average Decline: 23%
Wide diversification is only required when investors do not understand what they are doing. - Warren Buffett
Perhaps Jim Cramer should consider wide diversification. He apparently felt that retail stocks were the newwinners of the new world.
Compare and contrast...
Consider Nordstrom (JWN). I mean, what the heck? How can that stock be up this much on absolutely nothing? We have a story about how Sears (SHLD) basically doesn't have a real CEO, and the stock is up 20% in a month. - Jim Cramer, May 4, 2010
How did this bizarro world where nine-tenths of the companies I have followed as a stock picker for the last 20 years are losers and one-tenth are winners? To answer that question, you have to throw out all of the matrices and formulas and texts that existed before the Web. You have to throw them away because they can't make money for you anymore, and that is all that matters. We don't use price-to-earnings multiples anymore at Cramer Berkowitz. If we talk about price-to-book, we have already gone astray. If we use any of what Graham and Dodd teach us, we wouldn't have a dime under management. - Jim Cramer, February 29, 2000
As a side note, you really have to hand it to Sears. It's apillar of strength once again.
Here's a chart showing wage and salary disbursements as a fraction of personal income.
As seen in the chart, the long-term goal appears to be to phase out wages and salaries entirely and switch to a pure making money off of money wealth redistribution system. That should do wonders for our economy.
Unfortunately, the economy appears to do poorly when wages and salaries as a percent of personal income falls. You can also see the effect on a smaller scale within every single recession. It's almost like main street has a harder time shopping and paying bills when it does not have wages and salaries. Who knew?
Here's a conundrum for you. Wages and salaries as a percent of personal income have been falling throughout this recovery, just like they've been falling since 2000. Meanwhile experts like Jeremy Siegel feel that we should continue be as optimistic now as we were heading into 2000. Explain that.
Growth investors go wrong, however, when they try to pick a small handful of winners, Siegel said. You might end up with too much Coke and too little Lucent (or the opposite when their relative market value turns).
Here's a chart of Coke that comes up a bit flat and a fascinating story about how Lucent managed to raise its stock price in the aftermath of $26 billion losses. Enjoy!
If 10-year interest rates, which are now 2.8%, rise to 4% as they did last spring, bondholders will suffer a capital loss more than three times the current yield.
The investment could potentially lose as much as the S&P 500 has lost since May 1st and then potentially recoup those losses in the following months as higher interest rates once again freak out the weakened housing and stock markets? OMG! Bubble!! Sell! Sell all bonds!
We believe what is happening today is the flip side of what happened in 2000. Just as investors were too enthusiastic then about the growth prospects in the economy, many investors today are far too pessimistic.
The rush into bonds has been so strong that last week the yield on 10-year Treasury Inflation-Protected Securities (TIPS) fell below 1%, where it remains today. This means that this bond, like its tech counterparts a decade ago, is currently selling at more than 100 times its projected payout.
Why didn't I think to compare my TIPS to the tech stocks of 2000?
If we buy the 10-Year TIPS this very minute and hold it the full 10 years then...
1. We are GUARANTEED to get ALL of our money back, even if deflation strikes.
2. We are GUARANTEED to get an additional amount to compensate us for 10 years of inflation.
3. We are GUARANTEED to get an additional 0.96% per year in interest.
Yes sir. That's exactly like Jim Cramer'sWinners of the New World, well, once you strip out all the guarantees anyway.
I wish you could see my eyes rolling now. They've never moved this sarcastically before. I can't even keep them in the sockets. It's making me so dizzy that I'm tempted to vomit.
How will this all end? Ideally, before inflation takes hold in the U.S. and Europe, the costs in emerging economies will rise high enough for multinationals to invest and hire in the West again. I wouldn’t count on that. The average wage in the developed economies is 10 times that in emerging markets. There are five people in the latter for one in the former.
A more likely scenario is that the West will have to stop stimulus programs when inflation spreads to it from the emerging economies. The most immediate channel is through rising commodity prices. It’s a tax on the West to benefit emerging economies that produce raw materials. That’s the irony: The stimulus in the West can immediately bring harm to itself. It’s also the magic of globalization.
I turneddeflationaryon November 9, 2009. WTI crude oil was $79.44 on that day. As of today, it is now $75.77. The seasonally adjusted CPI was 216.859 in November 2009 and it was 217.597 in July 2010. That's a 0.34% increase (0.51% annual pace). I had hoped for a bigger bang for the deflationary buck.
I'm willing to stay deflationary through yet another Christmas season but then all bets are off.
I continue to own inflation protected treasuries and I-Bonds. That's my long-term plan to ride out the storm. I expect to experience pain, mostly through the taxation of the inflationary gains if serious stagflation does appear.
China's housing oversupply isn't surprising. Excess supply reflects the under-pricing of capital, and China's system is structured to increase supply quickly. But rising prices alongside rising vacancy rates are surprising. Normally, speculators are spooked by high vacancy rates. But China's phenomenon is unique for at least four reasons:
I will leave that as a teaser. The article deserves to be read in its entirety.
And lastly, if Andy Xie is right then the 1970s will look like a picnic by comparison. We'll be heading into a stagflationary environment with unemployment already high. Ouch.
Interest earned on 90-day Treasury bills below the inflation rate is a signal for governments to try to stop deflation and reflate the economy. When this happens, gold becomes attractive. We are in such an environment now.
That's really good to know. So if interest earned on 90-day Treasury bills is 10% but the inflation rate is 12% then that will be a signal for governments to try to stop deflation and reflate the economy. No wonder the 1970s were so awesome for gold. The government spent nearly the entire decade successfully fighting deflation. Who knew?
The twin engines of negative real interest rates and government deficits tend to make gold a very attractive investment. Recent research supports our historical findings on what drives gold.
So deflationary environments are known for their negative real interest rates? I mistakenly thought that was a stagflationary environment. I stand corrected!
The Federal Reserve’s main interest rate is near zero and inflation is a little over 1 percent, so we now find ourselves in a negative real interest rate situation.
So if inflation is a little over 1 percent, then this would still count as a deflationary environment? It's like everything I ever thought I knew was wrong.
I'm almost convinced. I'm earning a little over 1 percent in my ING Direct savings account and inflation is a little over 1 percent. I clearly wouldn't want to lose too much of my purchasing power by continuing to do that. Perhaps I should move money into something that's risen 400% over the last decade just to be completely safe. Hey, maybe I can even borrow money at these incredibly low interest rates and leverage up my bet. It sounds like a sure thing.
I still need to know why gold's price fell in late 2008 as oil crashed in a spectacular way and housing crumbled though. That part is still confusing to me. If that wasn't a deflationary environment, then what was it?
As I look to his charts for more insight, I see that the low gold prices of the 1990s eventually led to cuts in exploration, which led to falling production, which led to higher gold prices. That will be especially good to know if I ever find myself back in the 1990s again.
I thank CEO Frank Holmes for his unbiased gold insights and hope that his World Precious Minerals Fund (UNWPX) and his Gold and Precious Metals Fund (USERX) do well for both him and his company.
I now understand why investorslove goldin inflationary environments, deflationary environments, andat any price. It all makes sense now.