 Step 1: Send the blue line down to 0%.Yeah, I know. There aren't a lot of steps. The formula is fairly simple.
This should not be confused with the housing bubble recipe just because all the ingredients are identical.Source Data:FRB: Selected Interest RatesSt. Louis Fed: CPI-U
In my last post I compared the price of gold and silver to the average price of aluminum, copper, lead, nickel, and zinc.I have updated the charts to show gold and silver vs. a weighted basket of those 5 base metals.Here's the basket. I've based the ratios on the average prices from 1900 to 2008.7.50 metric tons of aluminum5.85 metric tons of copper15.05 metric tons of lead1.82 metric tons of nickel12.45 metric tons of zincI'm now comparing one metric ton of gold and one metric ton of silver to that weighted basket.
 The conclusions from my last post remain the same.See Also:Gold and Silver vs. Base MetalsSource Data:USGS: Historical Mineral PricesKitco: Base MetalsKitco: Precious Metals
Here are two charts showing gold and silver prices compared to the average prices of aluminum, copper, lead, nickel, and zinc (as seen as the base metals on Kitco's website).The red line represents the median ratio from 1900 to 2008. The blue dot represents where we are now.
 Let's say fiat dollars are going to zero. Why on earth are you still buying gold and silver then? Surely base metals represent a far better relative long-term value now.This is not an endorsement to load up on base metals though. I'm not convinced fiat dollars are going to zero in the short-term. I could very well be wrong, but I still lean deflationary.I called gold the ultimate bubble, which means it may go higher. But it's certainly not safe and it's not going to last forever. - George Soros, September 2010I am a believer in his theory, especially as it relates to the base metals.Source Data:USGS: Historical Mineral PricesKitco: Base MetalsKitco: Precious Metals
Peter Crabb: Here's a tip about TIPS: Buyers don't really expect negative interestThe price paid for these bonds at auction is such that the real interest rate will turn out to be negative if inflation doesn’t occur.Real interest rates are GUARANTEED to be negative if inflation DOES occur. He's got this exactly backwards.
In fact, the only way these bonds could earn a positive real interest rate is if deflation strikes and the deflation protection that TIPS offers therefore kicks in.
Picture paying $1050 for $1000 bonds but then prices in general fall 50%. You'd be pretty darned pleased even though you overpaid for those bonds. You may not get the $1050 back, but $1000 is nothing to sneeze at. You'd definitely have a positive real return on your investment. You only lost about 5% as prices in general dropped 50%? Sign me up! I'd take that deal any day of the week.Can this really be true? Would people really lend at a negative interest rate?
The answer is no. U.S. Treasury bond investors don’t expect to lose money. They expect inflation to rise, and with it, the value of TIPS.I've got news for Peter Crabb (who has a doctorate in international and financial economics). The answer is yes. Investors expect to lose money in negative real interest rate TIPS when adjusted for inflation. They just don't expect to lose as much as some. If the investors are really smart then they are hoping for serious deflation.If investors are actually hoping for more inflation as Peter Crabb implies, then investors really are stupid. As I have said here time and time again, inflation never helps investors in TIPS. It only hurts them. The higher the inflation, the higher the taxes on the inflationary gains and the worse the real interest rate after taxes becomes. In any event, higher inflation cannot turn negative real interest rate TIPS into something that can actually protect purchasing power.If inflation moves back to its long-run average, these investors stand to earn much more.Yes, and if inflation moves to 100% per year and stays there, these investors stand to earn even more than that. Much more. The taxes on all those inflationary gains will nearly financially ruin them each and every year but as Peter Crabb says, "Investors want to be compensated for it."
I own TIPS. I hope inflation remains tame. I am most certainly not rooting for higher inflation on the hopes that I can say, "I told you so." My bragging rights would pale in comparison to the lost real purchasing power due to the taxation. In fact, serious hyperinflation would transform my bragging rights into idiot's rights, as I would be forced to admit what a lousy investment TIPS had become.
And now back to the first paragraph of the article.Is it real or not? Can investors make a real return today?If investors are buying negative interest rate TIPS thinking that they will make a real return if inflation picks up, then investors are stupid. There's just no other way to put it.Good frickin' grief.
A reader (jus me) posted this in the comments today.It's kind of interesting that the Fed could in theory reduce the money supply, if inflation got out of hand.
No one is charged with putting gold back in the ground, if gold-mining enthusiasm gets out of hand ...Now that would be something to see!I think there is an inspiring new "innovative new product" idea here, lol.Illusion of Prosperity's Wondrous Gold Preservation and Antitheft Kit!We send you a packet in the mail. You send us your gold bullion, gold watches, and gold jewelry. Upon receiving your gold, we melt it down and keep 10% for ourselves as our fee. We then take the remaining 90% and combine it with raw earth to form very small pieces of gold ore. We then mail it back to you. We pay all shipping charges. The gold ore you receive could then be buried all over your backyard making it that much harder to be stolen by criminals, government types, and/or criminal government types.What do you think? Would there be a market for this? Hahaha! :)On the off chance that this takes off, I'm not a complete charlatan. I'd feel obligated to send jus me royalty checks for inspiring the idea, lol.
The following shows the consumer price index plotted on a log chart. On a log chart, constant exponential growth is seen as a straight line. Click to enlarge.This is definitely not the 1970s, at least not yet. Note the difference in slopes between the two eras.
It is extremely similar to what Japan's been fighting for 20+ years though. As seen here, Japan has actually been experiencing "price stability" since the early 1990s. There's almost no deflation to speak of.Source Data:St. Louis Fed: CPI-U
P&G quarterly profit drops, but stock holds steadyThe big story for the quarter was higher commodity costs -- and whether the company will have to raise prices in a struggling economy to offset those new expenses. Chief executive Bob McDonald said P&G will try to cut costs instead of increase prices, according to Dow Jones.I guess that means we can't expect Procter & Gamble to go on a hiring spree anytime soon.But if price hikes are necessary, he said, the company will deal with those by launching innovative new products.I'm going to go way out on the limb here and suggest that the innovative new products will be overpriced relative to the existing products.
It would therefore make sense to "hoard" Procter & Gamble's existing "basic necessities" products at these low prices (through coupons issued at Costco for instance). Just a thought. What's the harm? Been there, done that, still doing it.
Gas City Files for Chapter 11 BankruptcyCHICAGO, Ill. -- Gas City Ltd., a Frankfort, Ill.-based chain of independent gas stations, filed for Chapter 11 bankruptcy protection this week, according to a Crain's report.D'oh!
October 26, 2010More 401(k) Savers Take LoansIn short, the loans and withdrawals merely reflect the times in which we live.I once again refer you to the quote of Fitch Ratings analyst Bob Curran from 2005. It was an attempt to calm our fears and is my favorite quote from the pre-crisis.April 7, 2005Home foreclosure listings surged in March"It may simply reflect our overleveraged society and the fact that people are carrying more debt on everything and it doesn't take a lot to affect a small percentage of them in terms of moving them from homeownership to not," Curran said.Here's what he said next."It's hard to make a case, based on what I see here, that all of a sudden it's become an enormous trend." He said the economy is improving and employment is growing, which bodes well for a homeowner's ability to make mortgage payments.Oops.
Last Friday I posted a Rubicon Sighting! One of the dividend stocks on Credit Suisse's Buy List was taken out behind the woodshed today.Kimberly-Clark’s Profit Declined 19% in QuarterThe results fell short of analysts’ expectations, and shares of the company, which makes Kleenex tissues, fell nearly 6 percent.
Costs for crucial materials like pulp and oil-based materials rose $265 million in the quarter, the highest quarterly increase the company has ever seen.Way to go Ben Bernanke! Let's hear it for the man driving up the highest quarterly increase in costs the company has ever seen. Surely that deserves a round of applause.If you look really close you can spot Kimberly Clark Kleenex between the garbage bags and the paper towels in the following picture. I have expanded my Kleenex hoard since that picture was taken (as new coupons appeared).
Unfortunately for Kimberly Clark, each and every package was bought with a coupon at Costco, which does not exactly scream high profit margins for the company itself. Further, I'm reaching a natural limit on just how much Kleenex I can actually hoard. Perhaps Kimberly Clark should have found a way to pass on their costs directly to me, but it would seem their competition is just too intense these days.Competition from less expensive store brands has increased during the economic downturn, and promotional prices have hurt the company’s profits.I must admit that I've been a big fan of those promotional prices. No doubt about it.All is not lost though.Toilet Paper Economics for the win!
Bankruptcy Rising Among Americans 65 and OlderIn 2007, bankruptcy filings for those 65 and older represented seven percent of all filings, compared with 2.1 percent in 1991 and 4.5 percent in 2001....
She added that she has seen more retired persons living beyond their means.As George Bush would say, they are working hard to make the pie higher.
EE/E Bonds Rates & TermsEE Bonds issued May 2005 and after earn a fixed rate of interest. The fixed rate is determined by adjusting the market yields of the 10-year Treasury Note by the value of components unique to savings bonds, including early redemption and tax deferral options.
Rates for new issues are adjusted each May 1 and November 1, with each new rate effective for all bonds issued in the six months following the adjustment.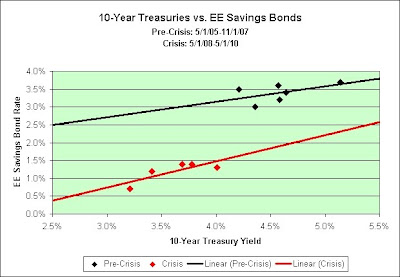 EE Savings Bonds currently yield 1.4%. The 10-Year Treasury Note rate was 3.69% when rates were last set back in May.
The 10-Year Treasury Note rate on 10/22/10 was 2.59%. That's a 1.1% drop and we should expect a similar drop in EE Savings Bonds.I'm basing my prediction on the crisis trend line in the chart above. Based on today's rates, I'm guessing 0.5%.
There is also a possibility that the original maturity will increase. It is currently 20 years. EE Savings Bonds are guaranteed to double if held until maturity. That puts the current long-term rate at 3.53% (2^(1/20)=1.0353).
For what it is worth, I'm a buyer this week. I do not expect to hold it the full 20 years but I'd like to have the option. In the meantime, I'll be earning a better rate than my online savings account.See Also:I-Bond Rate Prediction for November 1stSource Data:FRB: Selected Interest Rates
I'm predicting a fixed rate of 0.0% and a composite rate of 0.74%.In March 2010 the CPI-U was 217.631.In September 2010 the CPI-U was 218.439.That's a 0.37% increase over the six month period. Inflation has once again been very tame.Fixed rate = 0.00%Semiannual inflation rate = 0.37%Composite rate = [Fixed rate + (2 x Semiannual inflation rate) + (Fixed rate x Semiannual inflation rate)]Composite rate = [0.0000 + (2 x 0.0037) + (0.0000 x 0.0037)]Composite rate = [0.0000 + 0.0074 + 0.0000000]Composite rate = 0.0074Composite rate = 0.74%Here's why I think the fixed rate portion will be 0.0%.Contrary to popular opinion within the stock market, I would argue that we are still in crisis mode and as such the government will set the I-Bond rate based on crisis conditions. 5-Year TIPS rates are currently -0.39% (uncharted territory). That would imply a negative I-Bond rate as seen in the chart above. The government won't do that though. I expect the rate to be stuck at the 0.0% floor.Even at 0.0%, it would be clear that I-Bonds would be vastly superior to -0.39% 5-Year TIPS. I-Bonds can be cashed out without penalty after 5 years. Having the option to hold them an additional 25 years (tax deferred!) is clearly worth something too.
 10-Year TIPS rates are currently 0.50%. That would imply an I-Bond rate well into negative territory. Once again, the government won't do that though. I therefore expect 0.0%.Expect a lower rate on November's I bondThe fixed component in the earnings rate of the new I bond will likely be close to the spring rate, 0.2 percent. McBride expects 0.1 percent or 0.2 percent.Greg McBride is a Bankrate senior financial analyst. I think his prediction will prove to be incorrect. I think 0.0 percent is the closest thing I've seen to a "sure thing" in a long, long time. I could be wrong though. Time will tell.McBride also offers some options to I bonds in the current environment.
"Better inflation hedges are longer-term Treasury Inflation-Protected Securities such as the 10-year TIPS. And other asset classes such as dividend-paying stocks, REITs, commodities and other real assets, although there aren't any screaming values in that group," he says. The caveat is that other asset classes can be much more risky than the Treasury-backed I bond."Better" inflation hedges can be found but they can be "much more risky"? Seriously? Is the "better" adjusted for risk and reward or is the "better" just assuming maximum reward? Perhaps "much more risky" investments are always better? Who knows?Take his 10-Year TIPS recommendation. It currently pays 0.5% over inflation but one cannot defer the taxes. That means you have to pay taxes on those inflationary gains each and every year. If inflation really picks up then I-Bonds paying just 0.2% would dramatically outperform 10-Year TIPS if held outside a retirement account. Further, if interest rates rise dramatically those 10-Year TIPS would experience a loss if sold to others. I-Bonds do not have that problem though. They can be cashed out after one year with a modest 3 month interest penalty or cashed out after just 5 years with no penalty at all.Further, if deflation strikes again TIPS can lose money on any inflationary gains that accumulate. I-Bonds can never lose money, even if they have increased due to inflation in previous months. They can never drop in value.On a risk vs. reward basis for those wishing serious inflation protection and deflation protection, I think today's 0.2% I-Bonds are vastly superior to 10-Year 0.5% TIPS.
Of course, you could try his commodity recommendation instead. Rumor has it that there is no wilder casino in the world than an online commodities account. Good luck!
This should not be considered investment advice.Source Data:St. Louis Fed: CPI-UI Savings Bonds Rates & TermsU.S. Treasury: Daily Treasury Real Yield Curve Rates
You may note that my headline is somewhat different from the following headline and those differences are important.October 23, 2010Construction slump costs SoCal $29 billionThe Construction Industry Research Board reported in 2006 that residential construction alone (not counting Commercial or Public Works) contributed almost $40 billion of business activity to our region’s economy. In 2009 – just three years later – the number shrunk to just under $11 billion. That is almost $30 billion of economic activity lost in our region, and demonstrates how construction is an important economic engine that Southern California cannot afford to shut off.In order for the construction slump to have cost southern California $29 billion, we'd first need to believe that the $40 billion in business activity was actually sustainable. Was it? Here are two arguments that might show otherwise.1. There are 24.2 million people living in southern California. $40 billion per year represents roughly $1,650 per man, woman, and child per year. Over the course of 30 years, that would amount to $50,000 per man, woman, and child dedicated to *new* residential construction.
Here's one problem with the $50,000 math. California already has 13.4 million housing units (with roughly 2/3rds of them in southern California no doubt). Just how many more are/were actually needed?
Here's another problem with the $50,000 math. Those who already own homes have no interest in funding the construction of homes for those who do not own homes. That means the $50,000 figure is FAR too low. And when I say far too low, I mean the actual number would knock your socks off.
Here's yet another problem with the $50,000 math. $50,000 for every man, woman, and child already represents a whopping $150,000 per family of three (every 30 years)! And it is far too low? Seriously?
The math clearly shows that $40 billion per year is therefore not even remotely sustainable long-term. This is actually the weaker of my two arguments though. The following argument is 100% objective.
2. Hindsight. Was $40 billion per year sustainable? Hindsight shows not!
I would therefore argue that it wasn't the slump that cost southern California money. It was the unsustainable boom that was guaranteed to bust. The "missing money" was borrowed and spent on castles built on sand. When the tide came in that money vanished and left a giant debt hole in its place.
Construction slump costs southern California $29 billion? Oh please! Stop already! Economics should not be a comedy routine!
But what would we expect Rich Lambros (the CEO of the Building Industry Association of Southern California) to say though? Biased comedians abound!October 23, 2010Home Prices Double Dip in "Sudden Dramatic Drop"; 20% More to Come says Gary ShillingVideo: Gary Shilling says single-family home prices will drop another 20% over the next few years with number of homeowners underwater to rise from 23% to 40%.What can be done about the problem? Rich Lambros would suggest that we need to build more homes clearly while simultaneously figuring out a way to prop up their prices. Good luck on that one!
Readers of this blog may recall that my sarcasm disclaimer refers to a long standing joke about the 1200 level on the S&P 500 (the "Rubicon" level).Credit Suisse is now backing my sarcasm theory!October 22, 2010Credit Suisse: Buy These 20 Dividend StocksBOSTON (TheStreet) -- Credit Suisse(CS_) says U.S. stocks will trade within a narrow range. The bank predicts a ceiling of 1,200 on the S&P 500 and a floor of 1,000. It's no wonder the bank is recommending clients purchase dividend stocks.Here's the crazy part. I have actually been considering some of the stocks on that list (consumer staples) for the money in my IRA. I'm in no hurry though, especially if Credit Suisse's 1,000 to 1,200 range holds true. We are at the very upper end of it right now after all.
Based on the currently pathetic real yields of TIPS (Treasury Inflation Protected Securities), there is actually a chance that the cash in my IRA may actually be redeployed into relatively defensive stocks again at some point. Maybe.
Andy's Anagram SolverFed Chairman: "Chard famine!"Monetary Policy: "Playroom nicety?"Quantitative Easing: "Squint? Naive? Agitate!"Interest Rates: "Testes terrain!"Money Supply: "Plump Yen? Soy!"Treasury Bonds: "Sour bystander!"Budget Deficit: "But... decide? Gift!"Cumulative Trade Deficit: "Additive crime? Fluctuate!"Consumer Credit: "Circus mode? Rent!"Home Mortgage: "Egg? Ammo? Other!"Unemployment: "Pun money melt!"Crude Oil Prices: "Corpse ridicule!"Exponential Growth: "Export ethanol wing!"And lastly...Illusion of Prosperity: "Fusion pill repository!"This post inspired by a reader who emailed me "We cannot afford it" and its anagram "Daft, now fornicate!"
Too funny!
Is Betting Against the US Dollar Really Such a Good Idea?According to Shawn Hackett, founder and president of Hackett Financial Advisors, only 3% of traders are bullish the US dollar right now. In June, that number was 95%.Talk about a crowded trade!
For what it is worth, I continue to lean deflationary. By definition, that pretty much makes me a dollar bull right now.
Here's what I wrote last month. You can see the seasonally adjusted charts if you are so inclined.September 14, 2010Seasonally Adjusted LA Area Port TrafficThis month's data is out. I should update the charts but it takes a lot of work to seasonally adjust the data. I have to copy each data point individually out of the output files. There may be a better way but I don't know it. However, I can provide something nearly as good.September's loaded inbound traffic:Los Angeles Port: 373,249.35 Long Beach Port: 288,905.00Total: 662,154.35The seasonal adjustment program offered a forecast into the future and I still have that data available to look at. It predicted 674,887.32 loaded inbound containers for September. 662,154.35 is nearly 2% too few. The prediction range (with 95% confidence) was 604,607.01 to 753,337.12.Imports may therefore not be quite as strong as they might otherwise appear. The seasonal trends here are huge. As Calculated Risk accurately points out, there is normally a slight dropoff in September, but this appears to go a bit beyond that normal drop.
Update:September's loaded outbound traffic:Los Angeles Port: 139,800.25Long Beach Port: 124,021.00Total: 263,821.25The seasonal adjustment program predicted 268,364.94 loaded outbound containers for September. 263,821.25 is also nearly 2% too few. The prediction range (with 95% confidence) was 252,072.55 to 284,657.33.The slowdown appears to be affecting inbound and outbound traffic fairly equally.See Also:Calculated Risk: LA Port Traffic in September: Imports Strong, Exports Stalled
The following chart shows the percentage the food at home inflation index is above or below the overall consumer price index. As seen in the median line, the food at home index has tracked the overall CPI extremely well since 1984. This confirms my opinion that hoarding canned goods is a fairly good short-term inflation hedge. Hindsight shows that it was also an excellent thing to do heading into the 1970s.In 2008, we saw oil hit $145 per barrel. Some of that did temporarily trickle into food prices. In the grand scheme of things, we experienced a very minor episode of stagflation. What comes next is, as always, very difficult to predict.I suspect that too many investors think stagflation is all but guaranteed right now. I could be wrong to think this way.Predictions of the euro reaching parity were common a few months ago. Now the consensus is for a never ending decline in the dollar (again). Call me a contrarian, but I tend to shy away from what the consensus thinks in general.About.com: Online Commodities Trading Versus GamblingI don’t believe there is a wilder casino in the world than an online commodities account. You normally have at least 10-1 leverage on your money and all it takes is a click of the buy or sell buttons to make a bet. The decision you have to make is whether you are going to be a gambler or a disciplined trader.I can't speak for others, but I have absolutely no desire to place heavily leveraged bets these days. For those who feel there are "sure things" to be found in the wildest casino, may luck be on your side. You might very well need it.Source Data:BLS: CPI Database
The following chart shows the difference in interest rates between the 10-Year Treasury and the 1-Year Treasury going back to 1954. I have included a median trend line to show what might be considered typical. The blue dot shows where we are today. Click to enlarge.This doesn't exactly look like the 1970s, at least not yet. We're spending more time above the red line than below it.Here's another way to look at that same data. The blue dot once again shows where we are today.
 Click to enlarge.If zero percent 1-Year Treasury rates are now semi-permanent (big if, think Japan though), then just under 2% would seem to be the fair value floor for the 10-Year Treasury rate.
The 1-Year Treasury rate is currently 0.21%
The 10-Year Treasury rate is currently 2.44%.Source Data:FRB: Selected Interest RatesU.S. Treasury - Daily Treasury Yield Curve
EE Savings Bonds currently pay 1.4% per year.1. It is a rate higher than my online savings account.2. If interest rates rise, I can cash them out without experiencing pain.3. If held 20 years, they are guaranteed to double in price. That's equivalent to a 3.53% annual rate (2^(1/20) = 1.0353).If we slide into Japan's ongoing deflationary mess, then that 3.53% rate is going to look pretty good.If we slide into the 1970s again, then they can be cashed out early (must be held one year, 3 month interest penalty if cashed out before 5 years).Here's the downside risk. Let's say inflation stays tame for 10 years and then we slide into 1970s style inflation. You only get 3.53% if held the full 20 years. You might wish to bail at the 10 year point though. Tough call.Just something to think about. The 20 year treasury rate is currently 3.39%. EE Savings Bonds are clearly superior to that no matter what happens, since they offer a higher rate if held 20 years and they offer other perks.EE/E Bonds Rates & TermsEE/E Bonds issued May 2005 and after earn a fixed rate of interest. The fixed rate is determined by adjusting the market yields of the 10-year Treasury Note by the value of components unique to savings bonds, including early redemption and tax deferral options.The 1.4% fixed rate on EE Savings bonds will most likely drop substantially on November 1st. The 10-Year Treasury Note was 3.69% on April 30, 2010. It now sits at just 2.53%. That's a drop of 1.16%.It is also quite possible that the time frame needed to hold them in order to double in price will also increase. As seen in the link above, it would not be the first time.
I consider this to be a one-time opportunity based solely on relative value. I will be a buyer this month before rates reset on November 1st. I do not expect to make an EE Savings Bond ladder part of my nest egg.
For those interested, TIP is the last fund I have owned and I continue to watch it with more than idle curiosity.
I did some math on it today comparing its expected returns to that of 0.2% I-Bonds. In my opinion, I-Bonds are now the much better bargain, both from a real return standpoint and from one of safety. Go figure.TIP vs. I-Bonds


