Showing posts with label my personal blunders. Show all posts

Thursday, September 10, 2015

Why I Have Near Zero Confidence in Financial News

September 10, 2015
Is Yahoo’s core business really worth $0?

Some parts are valued straightforwardly. For example, Yahoo holds nearly $6 billion in cash and marketable securities; dividing by Yahoo's 941 million shares, one finds a value of about $6 per share.

Most seem to love talking about cash. Few seem to love talking about debt. Why is that? Why did I have to look elsewhere to find out that Yahoo has $1.2 billion in debt. How can one do a net worth analysis if one ignores liabilities?

If Yahoo borrowed another $10 billion in cash should its stock price really go up another $10 per share? Or would that all be just smoke and mirrors?

If debt isn't mentioned on the article, and it's not, then what else might the article be missing in its simple "worth" analysis? Why should I trust any of it?

Put another way, if I told you that I had $2 million to fund a comfortable retirement then you might assume that I am doing great. It might be really easy for me to sell you a book on how I managed to do it so that you could do it too.

However, if the the first chapter of my book starts off by telling you that I borrowed $2.2 million to both fund my lifestyle and spend $200k to print books for suckers, then you might start to think that I'm a con artist. Behold the power of debt to change an opinion.

In all seriousness, there's no way you can accurately determine the value of a company in a page or two of simple analysis, which is very sad because most news won't even give you a sentence or two of simple analysis. Then there's Mad Money. Got lightning round cowbell? Booyah. Sigh.

Update:

Pacioli's comments are worth a read. It seems debt is not being ignored. I therefore must add the "my personal blunders" tag. Hey, nobody's perfect! ;)

Tuesday, December 3, 2013

Once, Twice, Three Times a Maybe (Musical Tribute)

The following chart shows real annualized private office construction spending per capita (October 2013 dollars).


Click to enlarge.


Correction:

I originally posted that this was real monthly private construction spending per capita. The data is monthly but it is a seasonally adjusted annual rate. The chart remains the same, only the description changes.

Source Data:
St. Louis Fed: Custom Chart

Friday, October 18, 2013

Our Economic Rocket Requires More Industrial Lifeblood (Musical Tribute)

The following chart shows the 6-month moving average of the monthly commercial and industrial loan growth at all commercial banks.


Click to enlarge.


April 14, 2009
FRB: Speech--Bernanke, Four Questions about the Financial Crisis

Credit is the lifeblood of market economies...

Update:

I originally posted that this chart was showing the annual change. It is showing the monthly change. Sorry about that! The conclusions and the data remain the same though, as only the description of the chart changes.

Source Data:
St. Louis Fed: Custom Chart

Tuesday, October 8, 2013

The Signs of Recovery

The following chart shows the 12-month moving average of annualized production and nonsupervisory sign (durable goods) employee minutes worked per capita.


Click to enlarge.

New businesses need signs. Right?

The signs aren't looking so good, both short-term and long-term.

Update:

After further review, I noticed that the chart's data was per capita and not per 1,000 people. That's been fixed.

Source Data:
BLS: Employment
St. Louis Fed: Population

Investment Advice Insanity

The following chart shows the 12-month moving average of annualized production and nonsupervisory investment advice employee minutes worked per capita.


Click to enlarge.

As seen in the long-term trend, the "expert" advice is spewing exponentially. It's as if the floodgates have been opened. That said, it looks like we're starting to run out of greater fools again though. Oh oh.

The next chart shows the 12-month moving average of how much these financial "experts" are paid per hour in inflation adjusted terms.


Click to enlarge.

Is it any wonder they are so optimistic? Stocks for the long run, blah, blah, blah. Now cough up $38.20 (February's recent peak) or forever be priced out!

As a side note, who really believes the advice is nearly twice as good as it was in 1991? We might need to hedonically adjust that advice inflation to factor in dotcom bubbles, housing bubbles, subprime fiascos, debt crises, higher unemployment, $100 oil, perma-ZIRP, and what not. Few "experts" could have seen that coming! Can't blame them for the perfect despair storm. The view out the rear view mirror looked fantastic!

This is not investment advice.

Update:

After further review, I noticed that the first chart's data was per capita and not per 1,000 people. That's been fixed.

Source Data:
BLS: Employment
St. Louis Fed: CPI
St. Louis Fed: Population

Wednesday, September 11, 2013

Household Median Income: Optimism vs. Pessimism

For the Optimists:

Click to enlarge.

It's a sure thing! Can't lose!

For the Pessimists:

Click to enlarge.

It's a sure thing! Can't win!

I sure wish there was a way to break the tie between the optimists and the pessimists. I could probably start by pointing out that the optimists have at least one thing wrong. Constant growth really should be using an exponential trend and not just a linear one. Here's the problem with a linear trend. If it takes roughly 20 years for median income to double once (as seen in the first chart for the most part), then it will take an additional 40 years for it to double again. See why linear trends kind of stink when it comes to growth?

That's what makes the pessimist case slightly more believable. Growth is definitely slowing. Both charts clearly show it. It's just that the first chart shows it in a much more subtle way. What would happen if the growth continues to slow?

September 9, 2013
Study: Demographics to Drag Down Median Income

Americans who expect wages to rise as the nation recovers from the recession may be in for disappointment. A new report suggests incomes may be headed downhill for decades.

Oh oh. Why?

Pointing to past decades, the economists say median household incomes rose 9 percent between 1979 and 1989 and jumped 13 percent between 1989 and 2000. They say the primary driver of this growth was women, The Wall Street Journal notes.

Women! I knew it! The *real* men among us will just need to convince women to each work 2 jobs! That seems totally doable in this increasingly automated and outsourced world with chronically high unemployment. I suggest, "I bet you can't work *two* jobs! You're just a woman!" That's sure to be a big hit in any household!

And when I say big hit, I mean that the future's so bright I gotta prepare a cold compress for my eye. I'll have quite the shiner! Although optimism means that I can expect the best possible outcome, I just don't have it in me. I'm clearly planning for more of a pessimistic worst-case bodily injury type of outcome, lol.

In all seriousness, we're so @#$%ed long-term. This is not investment advice.

This post inspired by Revolting as seen at Retirement Blues.

Update:

I originally stated that this data was in inflation adjusted dollars. It was pointed out to me in the comments by mab that this data didn't look inflation adjusted though. After further review, he was absolutely right. Although the data source used inflation adjusted data for the 2-year and 3-year median income averages, it did not use it for the single year averages (which I was using). I have added the "my personal blunders" tag to this post. I should have spotted it. All the conclusions here remain valid. In inflation adjusted terms, things are much, much worse.

Source Data:
U.S. Census: Income

Thursday, October 25, 2012

Extreme Initial Claims Danger v.20


Click to enlarge.


Click to enlarge.

The red trend line continues to drift away.


Click to enlarge.

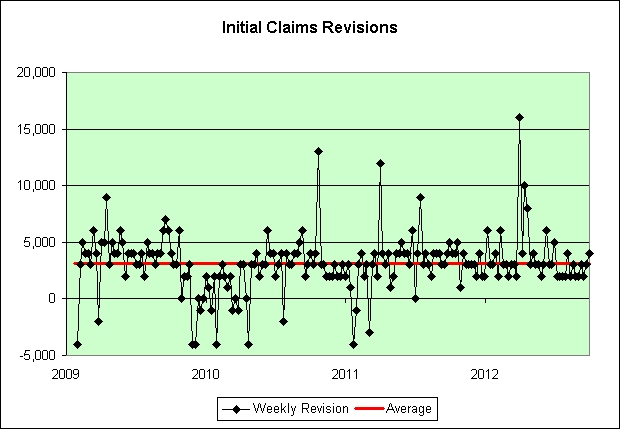
Speaking of Kahn, the previous week's initial claims were revised up yet again. That's 67 upward revisions in a row. I'm not arguing that this is all part of a grand conspiracy, but at some point you've got to think the DOL's estimation model could use a reality adjustment. Just sayin'.

Update:

At some point along the way I lost track of the count. It is actually 69 straight revisions. I am updating previous posts to reflect this.

The error crept about a month ago. I generally go to the previous week's data and add one. I must have looked at the wrong week. In any event, that's 4 "my personal blunders" labels. I must be an optimist. I think it could have been worse, lol. ;)

See Also:
Initial Claims Danger v.19

Source Data:
St. Louis Fed: Initial Claims
DOL: Initial Claims

Thursday, October 18, 2012

Extreme Initial Claims Danger v.19


Click to enlarge.


Click to enlarge.

We're back to extreme danger. The healthy red trend line continues to drift away.


Click to enlarge.

That's 66 straight weeks of upward revisions.

Update:

My count was off. It's 68 actually straight weeks.

See Also:
Initial Claims Danger v.18 (Musical Tribute)

Source Data:
St. Louis Fed: Initial Claims
DOL: Initial Claims

Thursday, October 11, 2012

Initial Claims Danger v.18 (Musical Tribute)


Click to enlarge.

I no longer feel the need to have the word "Extreme" in front of this post's title. Today's initial claims report was actually pretty good.


Click to enlarge.

We're desperately trying to get back to that red trend line. There is hope that this exponential trend failure can actually unfail. Wouldn't that be a first? In any event, we're in the Borderlands!


Click to enlarge.

That's 65 straight revisions to the upside.

Update:

October 11, 2012
So Much For Today's Surprising "Drop" In Weekly Jobless Claims; California Forgot to Report 30,000 Claims; What We Learned Today

The spokesman said that the unprocessed claims are likely to show up in the numbers in the next week or two. “We should see some sort of catch up.”

Hey, the euphoria was fun while it lasted. We now return you to your regularly scheduled programming. I guess there really ain't no heaven. At least I got the musical tribute right, lol. Sigh.

My count was off. It was actually 67 straight weeks.

See Also:
Extreme Initial Claims Danger v.17

Source Data:
St. Louis Fed: Initial Claims
DOL: Initial Claims

Thursday, October 4, 2012

Extreme Initial Claims Danger v.17


Click to enlarge.


Click to enlarge.

As with most trends, up becomes more likely once down is no longer possible. If that is indeed the case, the question then becomes, "How long we can stagnate at these levels?"


Click to enlarge.

Speaking of up, that's 64 consecutive revisions to the upside. The precision in the upward revisions is enough to make the keepers of atomic clocks jealous, lol. Sigh.

Update:

My count was off. It's actually 66 straight weeks.

See Also:
Extreme Initial Claims Danger v.16

Source Data:
St. Louis Fed: Initial Claims
DOL: Initial Claims

Wednesday, June 6, 2012

A Statistics Puzzle Revisited

March 18, 2012
A Statistics Puzzle

The debate is heating back up again and I think JeffJo is making some very interesting points. You might want to check out the comments.

Please post comments relating to the puzzle on the original post and not this one. Otherwise, we'll have two threads going simultaneously.

My original solution was incorrect and I have updated the post to show why it was incorrect.

Sunday, March 18, 2012

A Statistics Puzzle

March 18, 2012
A Fun DIY Science Goodie: Proof Yourself Against Sensationalized Stats

For example, in his very good monthly column Devlin’s Angle, he quotes the following problem, originally designed by puzzle master Gary Foshee: “I tell you that I have two children, and that (at least) one of them is a boy born on Tuesday. What probability should you assign to the event that I have two boys?”

13 out of 27. No joke. Tuesday really does matter. I offer you a table as proof.


Click to enlarge.

I used the often neglected but almost always useful "When In Doubt, Brute Force It" method. ;)

Note that there are 27 open possibilities in the table. 13 out of 27 are cases where there are two boys.

Hat tip to a friend for sending me this link. It took longer than I would like to admit for me to prove this to myself. Great puzzle.


Update:

My "proof" is now in doubt. JeffJo has made some interesting points in the comments and I'm leaning his way now.

Update #2:

I'm now convinced that the correct answer is not 13 out of 27 but is instead 1 out of 2. The 13 out of 27 only works if we poll the group. It does not work if the parents freely offer us information.

Here's the extended reasoning. We will limit our group to parents who would offer us information in the following form.

I tell you that I have two children, and that (at least) one of them is a [gender of child] born on a [day of the week].

Each parent has a choice to make. They can only tell us about one of their two children using this sentence structure. The following chart shows the impact of the parent's choice.


Click to enlarge.

As an example, let's discuss parents with one child #1 being a boy born on a Tuesday and child #2 being a girl born on a Friday. These parents must choose how to tell us this information. Half of them will tell us they have at least one boy born on a Tuesday. The other half will tell us they have at least one girl born on a Friday. That's represented as 50% in the chart.

Here's where it gets interesting. One set of parents has child #1 being a boy born on a Tuesday and child #2 being a boy born on a Tuesday. They will *always* tell us that they have at least one boy born on a Tuesday. That's represented as 100% on the chart.

Now that we've made the chart, let's do a real world example. Let's say there are 196,000 parents. If distribution is perfect, then each cell in the chart above holds exactly 1,000 parents.

Going back to my previous example, 1,000 parents will have child #1 being a boy born on a Tuesday and child #2 being a girl born on a Friday. However, only 500 of these parents would tell us about the boy. The other 500 would tell us about the girl. Symmetry demands this.

1,000 parents have child #1 being a boy born on a Tuesday and child #2 being a boy born on a Tuesday. All 1,000 of these parents will therefore tell us that they have at least one boy born on a Tuesday.

If we now add up all the parents who would tell us the original statement (using the table) then we will find the following.

14,000 parents out of 196,000 parents would tell us that they have at least one boy born on a Tuesday. Of those 14,000 parents, 7,000 have two boys.

“I tell you that I have two children, and that (at least) one of them is a boy born on Tuesday. What probability should you assign to the event that I have two boys?”

The article in Scientific American is wrong. The answer really is 1 out of 2.

I have added the "my personal blunders" tag to this post. Fair is fair. I missed a key aspect of this puzzle when I first tried to solve it.

Monday, June 6, 2011

A Risky Bet Revisited

March 1, 2009
A Risky Bet

I've been giving some thought today about how I have been consistently too optimistic even in my own dire predictions. I therefore offer a risky bet for those who feel that I continue to be too optimistic.

...

I'll be tracking California Pizza Kitchen in the years to come. I've been watching California's economy. I've been watching the restaurant business. I'm ashamed of myself for not thinking of it sooner.

The risk as I see it depends on whether this is a cyclical downturn or a secular downturn. I didn't start a blog based on the former, but I could be wrong of course.


This risky bet failed. There is no way to recoup the losses. I did not lose money on this bet (since I am risk averse), but I am still adding a "my personal blunders" tag. Fair is fair.

May 25, 2011
California Pizza Kitchen sold for $470M

Golden Gate Capital, a San Francisco private equity firm, said Wednesday that it will buy California Pizza Kitchen for $18.50 per share, or $470 million.

Although I continue to see ugly revenue and income growth, someone still saw hope there. It certainly wasn't the following person though and I must say that I share the sentiment.

May 19, 2011
California Pizza Kitchen's Numbers Taste Gross

Same-store sales were off 2.1%.

For what it is worth, I am still firmly in the secular downturn camp. You could probably have guessed that based on what I named this blog back in the fall of 2007. It isn't like I named it:

The Temporary Illusion of Prosperity

See Also:

The "Sure" Thing

Tuesday, May 31, 2011

Real Oil vs. Real Interest

The following chart shows the 10 year moving average of annual inflation adjusted 3-month treasury bill returns.


It is an oil speculator's dream come true. Do you want to know what else is an oil speculator's dream come true? Gregory Mankiw! They can see the unintended consequences of his negative real interest rate theories even if he can't.

Let's add the inflation adjusted price of oil to that chart and also add median values to strip out bubble activity.


I would argue that if short-term inflation adjusted interest rates had been kept nearer to their median value of roughly 1.4% then inflation adjusted oil prices would be nearer to their median value of roughly $40. In other words, oil prices could be more than double their typical value due to interest rate considerations alone.

How is this helping? Do higher oil prices help homeowners make their mortgage payments? No. Are wages double their typical value too? No.

The following chart attempts to show the correlation between short-term interest rates held low over an extended period and higher current prices for oil.


The blue dot shows where we are right now. I also want to point out that over the last year, investors have lost roughly 3% of their purchasing power in 3-month treasury bills. If this had been the trend for the last decade then this chart would imply oil's price would probably be even higher than it is now. I would therefore argue that oil speculators are trying to extrapolate even further into the future and they continue to like what they see.

So here is my theory in a nutshell.

Investors don't rush into hard assets based on temporarily low interest rates. The long continuous grind of lower interest rates on savers and/or speculators eventually makes them hoard hard assets. Those who see the problems coming hoard early and make out like bandits. Those who hoard too late end up being the bagholders someday.

It is that grind that makes them act. It explains the oil, gold, and silver bubbles in the late 1970s and it also explains them now. Keep in mind that it is just a theory and opinion. I could be wrong to think this way. I will once again say that I have absolutely no desire to hoard oil, gold, or silver at these prices though. The lowest lying fruit from those trees was picked years ago. Only the riskiest stuff is left.


I wish I could say when this "ultimate bubble" process will end, but I've been predicting low real interest rates since starting this blog. That said, unless the Fed intends to allow hyperinflation without a fight then there will come a time when they will be forced to act. They won't have a choice, any more than Volcker did.

And lastly, if we actually slide into Japan's deflationary mess then short-term real interest rates will rise. Short-term savers in Japan have not been punished like short-term savers here have. In other words, it might not even take a Volcker.


Update:

In my second chart I intended to use the median values but instead used the average values. That has been corrected. I have also inverted the interest rate scale to better show the relationship (hat tip to Rob Dawg at Calculated Risk).

mab pointed out in the comments that my median value still didn't look right. In my haste to make my last correction I accidentally used data going all the way back to 1946. Two wrongs didn't make a right. I think this deserves a personal blunder tag so I'm adding that too. D'oh! I'm fairly sure it is all correct now though.


Source Data:
St. Louis Fed: Spot Oil Price
St. Louis Fed: 3-Month Treasury Bill
St. Louis Fed: CPI-U

Thursday, April 21, 2011

5-Year TIPS Auction Results

TREASURY AUCTION RESULTS

Interest Rate 0-1/8%
High Yield -0.180%

Amazing. The TIPS pay 0.125% in interest and adjust for inflation but were bid up to the point they have a -0.18% yield overall.

What it means that TIPS yields are negative

In this case, if you think inflation will be higher than 2.35% on average over the next five years, the TIPS are the better investment.

It is like comparing two types of dung.

Those who bought the 5-year TIPS without at least buying the 0.0% I-Bonds first were not thinking this through.

1. I-Bonds are tax-deferred.
2. I-Bonds cannot deflate (even month to month).
3. At 0.0%, I-Bonds have a better rate.

Win, win, win.


March 12, 2011
Yield Curve Thoughts

Based on those tender instructions and the Treasury's comments about negative yields on nominal bonds, I'd be somewhat surprised if the 5-year TIPS yield is below 0% during the next initial auction on April 21, 2011. I could be reading this wrong, but 0% does seem to be the floor during an initial auction. I suppose it is possible that the bonds can have a 0% floor in an initial auction but you still need to pay a premium to get that rate. It seems unlikely to me though.

Color me somewhat surprised. In my defense, I see that they have changed the tender instructions as of April 2011. The old instructions said:

Note About TIPS: Should the accepted auction yield be 0% or less, the security will not have regular semiannual interest payments. The yield will be adjusted for inflation throughout its lifetime, thus posting changes at maturity (or sale). In this case, where the accepted auction yield is 0% or less, the interest rate will automatically be set at 0% (never anything lower) for all buyers.

See here. The note about TIPS has been removed.

This changes things a bit. There is apparently no interest rate floor on TIPS in an initial auction. Investors can bid down the real yield as far as they like. Good to know. This will make it easier to someday recreate the stagflation of the 1970s in all of its former glory if we so desire.

When I first started investing in TIPS back in 2000 I never imagined a day where investors would willingly accept negative real yields long-term. It was my thinking that the 1970s simply snuck up on investors. My mistake. Apparently it all just comes down to relative dung value.

Thursday, March 4, 2010

The Basis of an Illusion of Prosperity

Smart People (pdf)

Repeated good outcomes provide us with confirming evidence that our strategy is good and everything is fine. This illusion lulls us into an unwarranted sense of confidence and sets us up for a surprise (usually negative).

This is a big risk. See The "Sure" Thing.

Know What You Can’t Predict

In most day-to-day decisions, cause and effect are pretty clear. If you do X, then Y will happen. But in decisions that involve systems with many interacting parts, causal links are frequently unclear. For example, what will happen with climate change? Where will terrorists strike next? When will a new technology emerge? Remember what Warren Buffett said: “Virtually all surprises are unpleasant.” So considering the worst-case scenarios is vital and generally overlooked in prosperous times.


In my opinion, what a great article!

This post inspired by GYSC.

Wednesday, December 30, 2009

The Sarcasm Report v.38

Will the China property bubble pop?

Beijing, China (CNN) -- When Crystal Zhang decided to buy a house last August, it seemed like a no-brainer.

For years, she had been spending a big chunk of her salary renting a studio apartment in Beijing, where she works as a mid-level executive in a multinational company. But her landlord kept hiking the rent, so she found a second-hand apartment and plunked 640,000 RMB (nearly US$100,000) as 52 percent down payment for a new home. She now lives in a cozy, one-bedroom flat and sets aside 25 percent of her monthly salary to pay for mortgage. "I hope to pay all up in five years," says Zhang. "By then I can start making some other investments."

Zhang, 30 and single, is one of the fortunate ones. The upwardly mobile professional has ample disposable income--and a good sense of timing. In just five months since she bought her 85-square-meter apartment, it has already appreciated by 38 percent. "I'm glad I bought this one when I could still afford it, even though its price was already high," she said. "Now the price is ridiculously high."


85 square meters is 915 square feet.
$100,000 x 1.38 = $138,000.
That's $151 per square foot.

Update: G.H. spotted a math error here. It's roughly twice as expensive. See below.

When I bought my home (just outside of Seattle, WA) in 1997 I paid less than $100 per square foot. It's a fairly nice house on 1/3rd of an acre. It has two fireplaces and a three car garage. It is currently assessed at about $170 per square foot, down from its $200 peak.

I had no idea I was competing with upwardly mobile Chinese professionals on such a level housing playing field. I'm still slightly in the lead, but I'm really losing some ground here. This is truly embarrassing. I'm going to lose to a second-hand apartment. I can feel it in my bones. I need to step up my game.

My only hope is that China continues to build more 85-square-meter apartments to the point that prices come down. For the life of me I can't figure out what to do to make my own house price go up any more. That's for sure. Mowing the lawn no longer seems to be offering any bang for the buck. It's as if I mow it simply to partially maintain the existing price. What an exercise in futility that is becoming!

If only I lived in China. I'd still be competing with a billion people, sure, but there also seems to be a billion "no-brainer" investments to match. How could I lose?


Nobody ever loses betting on China!

Update: G.H. has pointed out in the comments that my math was way off. I thought $100,000 was the purchase price. That was just the down payment though. That means the apartment cost roughly twice as much and I have already lost the race. Big time! Wow!

Thursday, October 29, 2009

TIPS to the Rescue!


U.S. BANK CHECKING ACCOUNT ADVANCE


If eligible, you may borrow between $20 and your available credit limit. If your checking account is overdrawn, you must borrow enough to bring your checking account balance to a least a $0 balance.

The finance charge is $2 for every $20 borrowed. This is an Annual Percentage Rate (APR) of 120%.


Wow!

It all started with a mistake I made this week. My property tax bill is coming up and although I had plenty in my checking account to cover it, I opted to transfer a bit more money over from an online account at another bank as an extra buffer. Call me paranoid but I don't like running with low balances. All it takes is one excess banking fee to turn free checking into something quite expensive.

Being one of those careful double-checking types, I called my bank's automated system today to see how much money I had available before cutting the property tax check. It was FAR less than I knew it should be. It took me all of 5 seconds to figure out what I had done.

I mistakenly transferred the money the wrong way! Rather than put additional money in to serve as a buffer, I actually yanked out my previous buffer and a whole lot more. D'oh!

This brought me to the next startling fright. It is the Halloween season and more tricks were clearly on the way. My balance should be negative. If not now, it soon will be.

I then called customer service and asked what my options were. I've never actually had a check bounce and figured there might still be time to head it off.

He offered me $500 at a 120% annual interest rate. Gee, thanks! With friends like that, who needs enemies? Another option he offered was to do nothing and let the fees pile up as checks began to bounce (he worded it in a much friendlier way). I ended that conversation and decided to dig further on why my account actually was not negative already. Maybe I could hit the problem from the other end.

That's where TIPS came in. Thank you US Government. You deposited interest in my checking account on October 15th (one day after the period my last bank statement covered). Saved by a timing miracle!

I'm not completely out of the woods yet, but at least I have more control over where this goes. At least I won't be bouncing checks. Whew!

I immediately transferred more money from my online account to my brick and mortar bank. Time is not on my side though. The property tax check must be postmarked by October 31st. I'm hoping that I can see the money show up in my US Bank account by Saturday AND get confirmation from my bank that they won't put a hold on the funds. I'm fairly confident I can get the latter if I arrive in person and explain it. I've had some practice at it over the years (mostly when moving money to buy I-Bonds). Persistence and a good credit record goes a long way.

I may need to pay my property taxes late though, depending on how it goes. I'm certainly not guaranteed success. Regardless, it is far better than bouncing checks and/or paying 120% interest rates though. Paying a month late should cost me just over $30. I'm hoping it doesn't come to that, but at least I miraculously managed to fend off at least some of the pain (blind luck).

And lastly, I want to point you to something my bank statement used to say on it (but says no longer).

Summary of Your U.S. Bank Relationship

What happened to our relationship? Was it something I said? Why are you offering me 120% interest rate loans? You seem so cold and distant these days.


I am once again reminded of the economic pain that millions of people go through each and every month in this country. I had money but simply had it in the wrong place. There are many who simply don't have the money at all. The banking system is there for them, much like the loan sharks of the past.

As Cobleigh explains, "The real aim of loan sharks is to keep their customers eternally in debt so that interest (for the sharks) becomes almost an annuity."

Sunday, September 2, 2007

The "Sure" Thing

The year was roughly 1984. There was a horse racetrack not all that far from me. Well, I knew how to program a computer so I figured one summer that I'd just see what I could extract from the racing forms. At that time, there weren't that many people who knew how to even operate a computer so I clearly had an advantage, or so I thought.

I knew I wouldn't be able to compete with others in spotting the best horse but maybe, just maybe, I could mine the data for some sort of pattern in the betting. It is one of the few forms of gambling where a betting system could theoretically work. I'd just have to bet much "smarter" than the average person competing against me (in order to offset the money from the pool the track takes). I therefore put a year's worth of race data into my computer and to the best of my memory (it's been 20+ years) this is what I found.

In a six horse race, the 4th best horse to win (according to the betting consensus) was paying more than the $2 bet on average.

In a seven horse race, the 4th, 5th, and 6th best horses to win paid more than $2 on average.

In an eight horse race, the 5th horse to win paid more than $2 on average.

In a nine horse race, the 5th, 6th, and 7th best horses to win paid more than $2 on average.

In a ten horse race, the 6th, 7th, 8th, and 9th best horses to win paid more than $2 on average.

I looked at that data and thought I'd just found gold. I started to think about how that could be? I decided that perhaps the city was just too conservative. Nobody was taking enough risk. (Sound familiar? It should. Think subprime!)

But that's not all. I saw more patterns. The system worked best on the weekends. That made perfect sense to me. The most experienced gamblers played throughout the week but the most inexperienced bet on the weekends. That seemed clear. This backed my original theory and improved my confidence in it.

I'm not done yet though. There were patterns in the exactas and the trifectas. They paid especially well and the system was once again very consistent. The best bet was pairing the favorite with the 9th best horse in a 10 horse race for the exacta. For the trifecta, I should bet the favorite to win, the second best to come in second, and the 9th best horse to come in third. The system was simple, elegant, and believable. It was all coming together very nicely. I had a system and a theory that explained the system. What more could I want?

So off to the racetrack I went. I'd bet $2 on every horse in my system. I'd wait until the last possible second and let the consensus determine my bets. I'd often find myself rooting for four horses to win in the same race! One time I remember yelling, "Anything less than 5!" That turned a few heads, lol. People thought I was nuts, but I walked away with money virtually every single time I went out there. Even on bad days, I'd only lose a little, simply because I was making so many bets that the averages worked in my favor. It paid for my admission thoughout the summer and I built up quite a little sum in reserve. Things were going fantastic. Oh the stories I have. I predicted that Father's Day weekend and Memorial Day Weekend would be especially good (because people were allowed in for free and the place was packed). Yep, those were the two best days of the year. I won an exacta and FOUR of the races (betting on longshots no less) on one of those days and did extremely well on the other. This system can't lose!

Near the end of the season I'd accumulated enough money to increase my bets. Well, sign me up. We're talking gift horses here and I was fully prepared to look them in the mouth!

That timing didn't work out so well though. Much to my surprise, the day was a disaster. None of my horses won in any race. The system completely and utterly fell apart. The next weekend I opted to pass. I wanted to know more about what went wrong. That was a good plan. My system would have once again done poorly. This was quite a shocker to me as you can imagine. I'd pretty much proven the "sure" thing all summer, but something had changed. I had no idea what it was.

That's when I opened the newspaper. Any guesses on what it said?

JOCKEY SCANDAL! It seems a stableboy had ten winning trifecta tickets. Each ticket paid just over $600 which meant, at the time, it had to be reported to the IRS. Well, somebody started wondering why a stableboy would have ten winning trifecta tickets in the first place apparently. From there, it all went downhill. At least one jockey was banned for life.

Oops! I wasn't winning because the city was too conservative. I was winning because the races were rigged! Guess which horses tend to win in rigged races? You guessed it, longshots! My longshots, lol. From then on out my system never worked again, nor did any other system I managed to think up. Some came close, but there was just no way to offset the rather sizeable amount the track took from each pot.

Yes sir, I might just as well have been running the show at Long Term Capital Management. Everything was fantastic until MY system seized up on me. Genius failed, lol. Fortunately, I did something far different than the people at LTCM though. At the first sign of danger, I shut my system down. Whew! I never was a gambler by nature. In order to play, I had to know the odds were in my favor. That first day of exceptional losses shattered my confidence. Overall, the season was still enjoyable. I'd only lost all my previous profits. I basically gambled for free that summer. I didn't lose overall but I didn't win either.

Maybe you'll think of my very humbling story the next time you are looking at a chart. I know charts. They'll lure you in and spit you out if you aren't careful. Even your gut can betray you, but mine has perhaps seen enough by now. With the fraud where I worked, the fraud in some of my investments, and the fraud at the racetrack my gut is quite the natural skeptic these days.

There is no "sure" thing. There is risk vs. reward. It isn't the known risks that will get you more than likely though, because you'll see them coming. It is the unknown ones.

So what's my gut think the worst risk of all is? Never bet on the "sure" thing!

Markets are constantly in a state of uncertainty and flux and money is made by discounting the obvious and betting on the unexpected. - George Soros