I live in the USA and I am concerned about the future. I created this blog to share my thoughts on the economy and anything else that might catch my attention.
This is the End and a New Beginning
-
I've been thinking about this for some time.
After 21 years of writing this blog almost daily, I've decided to stop
writing the daily updates on the blog.
...
Silver Deep Dive
-
Silver had a memorable year (+148%). Some of this can be explained by a
decline in the dollar. I decided to do some ML analysis to look for other
insights....
The following chart shows the natural log of the CPI for shelter. When using natural logs, constant exponential growth is seen as a straight line. I have added long-term trend lines in red.
With lofty housing prices and lofty mortgage rates, it seems very unlikely that we're going to make it back to the top of the trend channel anytime soon. Which, if you think about it, is kind of odd. I could swear that the Fed really wanted that. Just not all at once, apparently. Too bad.
If I were a gambling man, I would wager that there is more risk leaving the channel to the downside than to the upside. And maybe I am a gambling man, because I continue to hold TLT. Very encouraged by today's CPI report. One battle doesn't win the war though, of course.
So many consumer surveys, but none of them ask the key questions for the next year:
- How much did you accumulate in savings during the pandemic?
- How much do you have left?
- How much of that do you intend to spend?
Without the answers, forecast margins of error are *massive.*
The following chart shows household and nonprofit organization net worth divided by total debt in all sectors.
As seen using the red channel, this 60-year linear trend has failed by a large amount in the aftermath of the Great Recession. Epic failure, actually. Should have more of them. Never before has so much additional prosperity been generated by so little additional debt.
Of course, not everyone believes that fairy tales always have happy endings. Here's a scary fable involving bears that's just in time for Halloween.
Net worth has been falling rapidly lately, thanks to the stock and bond markets. We'd be back in the channel if it were to fall another 30% or so, assuming it were to continue to happen rather quickly. And what would be quicker than rapidly rising mortgage rates combined with million dollar homes?
Of course, there's another way to get back in the trend channel. Total credit market debt outstanding is only $91.2 trillion. Yes, only $91.2 trillion. A pittance, really. If we were to quickly increase it by 40% then back in the "safety" of the declining channel we would be. Think what we could do with all that free money! Here's an idea. A $36 trillion Halloween party in the name of world peace! Everyone on the planet could be invited. Nobody goes home empty handed. Woohoo!
Please don't confuse my love of gallows humor for sarcasm, nor my love of sarcasm for gallows humor. It's both. It's almost always both these days, lol. Sigh.
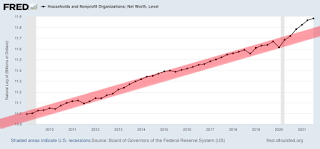
The following chart shows the natural log of household and nonprofit net worth divided by the consumer price index. When using natural logs, constant exponential growth is seen as a straight line.
The future's so bright, I gotta wear shades night vision goggles.
The following chart shows the natural log of the producer price index for all commodities. When using natural logs, constant exponential growth is seen as a straight line.
We've been screaming towards the top of the channel like a runaway train. Our engineer (the Fed) is now desperately attempting to apply the brakes. The odds of a soft train landing seem incredibly low. Beware the rapidly approaching Deadman's Economy Curve. We're likely to derail!
Some might argue that we've already derailed. The worst is now behind us. I'm not convinced. Since when has maximum pain been achieved with near record low unemployment? It seems to me that we still have plenty of pent-up depressionary pain potential. Surely the unemployment rate has not achieved a permanently low plateau, especially given all the financial pain both the stock and bond markets have recently dished out. In fact, it's entirely possible that the pain party might just be getting started. Perhaps the Great Recession will be followed up with an even greater one. *cringe*
This is definitely not financial advice. I am and have been very concerned about our long-term future, much like many must have been during the fall of the Roman Empire. Who is responsible? We all are.
Behold the household wealth creation of a pandemic combined with ZIRP. Broken window fallacies be damned. Break them, and break them good I say. It's a brand new era of unprecedented prosperity! And should this plan ever start to falter, look for plague, pestilence, and NIRP to save the day!!
Seriously. Other than recent bitcoin and stock market performance, there's absolutely no reason to fear downside risk or reversion towards the mean theories. Even in uncharted territory, the Fed always knows what it's doing. Always has your back!
I know I said I was serious in the last paragraph. It was gallows humor. Sorry about that. I actually just bought more I-Bonds. Not only do they track inflation as seen in the CPI, but they can never deflate. Not that many are all that worried about deflation again. Yet.
Months Elapsed: 8
Total Growth: 12.80%
Annualized Growth Rate: 19.81%
Distribution Yield (TTM): 2.80%
This isn't a sustainable growth rate. There is risk here, especially if inflation isn't transitory and yields don't continue to decay over the long-term. That said, I'm still comfortable holding it.
I did sell about half of my VPU position this month to buy BTI, MO, PM, and VZ. As a group, I'm up 0.66% on those. Would be doing better if I had not overweighted BTI and VZ. No plans to change course though. Feel good about the allocation.
And lastly, also bought platinum Eagles this month. On the one hand, it would cost 3.27% extra to buy them now. On the other hand, I would lose 3.67% if I sold them now. Still fighting the ~7% round trip spread. That was a tough long-term call. Could have bought a platinum fund that charges 0.5% per year instead. I therefore need to hold at least 14 years to make holding the coins the better choice. As an added bonus, holding platinum coins in one's hand beats holding a paper IOU, especially if there comes a time when many paper IOUs become worthless.
Chart shows the producer price index for salmon (blue), halibut (red), and meats (black) each independently divided by the consumer price index for all items. January 1950 = 1. Chart therefore shows how the real producer prices for these items have changed relative to what they were in 1950.
Is anyone keeping track of all the prosperity we've "borrowed" from future generations since the dotcom bubble popped? Seems like there should be a national database for it, you know, for posterity.
On a brighter note, the real producer price for meat is quite a bit cheaper. And to the best of my knowledge, it's not even that soylent yet. That said, meat hasn't exactly been getting cheaper since 2000. You could more easily see that in the chart if salmon and halibut weren't so shocking and awing.
The following chart shows the natural log of retail trade. When using natural logs, constant exponential growth is seen as a straight line.
As the pandemic hit, the exponential growth of retail sales failed to the downside. Using massive and mostly temporary stimulus, retail sales then overshot the historical channel and failed to the upside. Look where it's headed next. Welcome to the world of barely damped harmonic motion.
A broken shock absorber will result in your car bouncing around, as well as excessive rolling, squatting and diving. In other words, it won't be comfortable. Plus, your car will be harder to control, especially at high speeds. For that reason, you should never drive a car with a broken shock absorber at high speeds and avoid sudden turns and abrupt stops.
If you aren't even a bit worried about the current state of the Fed's economic shock absorbers, then maybe you should be?
The following chart shows the natural log of the 5-year yield. When using natural logs, constant exponential growth is seen as a straight line. I have added two such straight lines in red for your amusement.
At its current yield of just 0.71%, at what point did it ever become abnormal? After all, its natural log is currently centered between the two trend lines. What could be more normal than that?
For those who have $500,000 to invest, I want to tell you about an exciting opportunity that has suddenly appeared in the Treasury markets. And unlike Fisher Investments, this opportunity is provided absolutely free to loyal readers of this blog! There are no fees structured for me to do better as you do better! You will keep 100% of the profits!
As seen in the following chart, this exceedingly rare opportunity can be found in the 1-year Treasury note.
No, it's not the 17% in 1981. I can understand the confusion. Please allow me to zoom in closer.
No, it's not the 6% in 2000 nor the 5% in 2007. This is a current opportunity. Let me zoom in closer.
No, it's not the 2.5% from 2018. Don't we wish. One last zoom should clear this up.
Behold the miracle! After hitting a lifetime low of 0.04% in early June, the yield has risen to 0.07% today! That's an unprecedented 75% increase in less than two months!
If you have $500,000 to invest, gone are the days when you could safely earn $200 per year. Now it's $350! That's almost one dollar each and every day! Do not let this once in a lifetime opportunity pass you by!
As a side note, our pets haven't been this excited about one of my sales pitches since they attended one of my investment timeshare seminars. They endured four hours of presentations for the free dog treats, but it was so worth it. Just look at those smiling faces!
If the news says interest rates are rising, that's a forward looking opinion. It is not a fact. It is a prediction. In sharp contrast, if the news says interest rates have been rising, that’s a verifiable backward looking fact.
As examples, when the temperature recently hit 110 at my home, I would never have said that the temperature is high and rising. 110 was the peak. When a submarine reaches the surface of the ocean, no sane person ever says that the submarine is high and rising. The submarine is obviously done rising.
So why does the news do it with interest rates? It’s subtle. It’s biased. And I wonder if anyone else notices that an opinion often sneaks in there where a fact should go.
If it was so easy predicting where interest rates were truly headed then we could all become heavily leveraged bond day traders and never lose money. And yet, plenty of bond traders do lose money. I suspect most money is lost betting on what the news implies is obvious, while the professionals and algorithms take the other side of those trades.
One would think that since interest rates had been falling for 40 years, the burden of proof would be on those predicting the long-term reversal to rising interest rates. And yet, for at least the past 20 years, the burden of proof has always been on the “Japanificationists” as they continue to simply predict more of the same.
And on that note, I offer my opinions and predictions of more of the same.
1. Although inflation is running temporarily hot, we are not returning to 1970s style interest rates anytime soon, if ever, at least in my lifetime. Bet on long-term interest rates north of 3% over the long-term at your peril.
2. The recent growth of inbound loaded containers into Los Angeles and Long Beach (as seen here) is ridiculously unsustainable over the long-term. The recent growth of shipping costs into Los Angeles and Long Beach is therefore also ridiculously unsustainable over the long-term. Any price inflation seen inside those fully loaded containers due to extreme growth in the number of containers and their associated shipping costs is therefore also ridiculously unsustainable.
3. I don't want to sell anything, buy anything, or process anything inside those shipping containers when a sustainable reality hits. I don't want to sell anything bought or processed, or buy anything sold or processed, or process anything sold, bought, or processed, or repair anything sold, bought, or processed. Yes, I'm having a Say Anything moment. Pent-up demand can easily lead to pent-up demand destruction. I want no part of the latter. We did overshoot to the downside as the pandemic hit. We are overshooting to the upside now. We can easily overshoot to the downside again (like a pendulum with little dampening), especially if the Fed feels the need to fight transitory inflation.
This is obviously not fantastic investment advice. If it was so easy giving fantastic investment advice then we could all become heavily leveraged traders and never lose money. Right? Seriously.
Sorry to bring up heavily leveraged traders twice in the same post. I guess I just have historic margin debt as a percentage of GDP on my mind. Shouldn't be a problem in a temporarily overheating economy filled with sure things like SPACs, NFTs, cryptocurrencies, and Tesla though. What's the worst that could happen?
Months Elapsed: 6
Total Growth: 4.67%
Annualized Growth Rate: 9.56%
Distribution Yield (TTM): 3.02%
Received a distribution of $1.0140 per share this month which was reinvested at $139.29.
On the one hand, it was a bit disappointing. The distribution was down from $1.2578 in June of 2020.
On the other hand, VPU distributions were extremely volatile in 2020. Last year's abnormally high distribution (as seen here) made for a very difficult comparison this year. In theory, this September's upcoming distribution should have a much easier year over year comparison.
In any event, overall performance is more than safisfactory so far. As a long-term Treasury bond substitute, I have no complaints. At least not yet.
Firmly HODLING with cast-iron hands. They are strong hands, but they're also brittle and prone to rusting. ;)
Love this advertisement. Let's zoom in for a closer look.
South Park is using obsolete old school thinking. Why limit yourself to a 100% loss? Leverage up! A 459.66% loss for the win! 20 million people can't be wrong!!
Months Elapsed: 4
Total Growth: 9.20%
Annualized Growth Rate: 30.22%
Distribution Yield (TTM): 3.06%
The 30-year Treasury yield has risen from 1.67% in December to 2.30%. In hindsight, investing in utilities was a much better plan than locking in a 1.67% yield (the red target in the chart). Since I am not even remotely convinced that the long-term bull market in government bonds is over, those locking in 2.30% today might not be similarly disappointed though. That said, it would take a lot to be similarly disappointed. 30 years at 1.67% nets so much less than 30 years at 2.30%.
I suspect one short-term tailwind for utility investors to diminish as Treasury yields stabilize. Picture a recent safety-seeking retiree invested in low-yielding bonds who is looking at massive losses on those bonds, while also watching higher-yielding utilities actually going up in price. Painful. Is it any wonder that some therefore sold government bonds to buy utilities? As utility prices rise and Treasury prices fall, there is a growing temptation for me to sell utilities to buy government bonds though. The 30-year TIPS yield is currently only 0.02%, so the temptation is still very minimal.
The following chart compares the annual percentage change in personal consumption expenditures of food and services.
Looking forward to a return to normal.
There are three reasons we spent more money on food since the pandemic started. First, we have more food stockpiled. Second, our food has been delivered. Third, we have not been as price conscious. Taking advantage of sales hasn't been nearly as important to us over the past year. All of these things will soon reverse once we are vaccinated.
There is a disturbing fourth reason that food expenditures are up for others.
Weight change is a common symptom when people are having difficulty coping with mental health challenges. A majority of adults (61%) reported experiencing undesired weight changes, since the start of the pandemic, with more than 2 in 5 (42%) saying they gained more weight than they intended. Of this group, adults reported gaining an average of 29 pounds (with a median gain of 15 pounds), and 1 in 10 (10%) said they gained more than 50 pounds. For the 18% of Americans who said they lost more weight than they wanted to, the average amount of weight lost was 26 pounds (median of 12 pounds).
50 pounds is a lot to gain in one year, and a surprisingly large number of people managed to do it. Ouch.
For what it is worth, I intentionally lost about 10 pounds. It wasn't from eating less. I chose to walk more. I've averaged 6.7 miles per day during the pandemic. Trying to make a permanent habit out of both walking and cycling. Bought a bicycle late last year and will soon be riding it again. I'm optimistic that even more weight will be lost this summer.
I'm more optimistic in general. I do think inflation will be transitory. I do think interest rates will remain low. If true, I'm not even that concerned about debt. I don't currently see a stock market bubble or a housing bubble (although I do see pockets of great excess). Like Japan, it won't be a great era for savers, but that's okay. There are worse things than ZIRP. Not expecting the roaring twenties, but perhaps the meowing twenties? Could that be a thing?
I'm basing my optimism on a reversion to the mean, or lack thereof. We are continually told that when interest rates normalize, blah, blah, blah. I am arguing that rates have been normalized. They've been decaying exponentially for 40 years. That's what has been normal. Unless someone can give me a good reason why rates will soon stop decaying then I'm going to continue to believe that they will continue to decay. More money deposited in banks certainly won't lead to higher interest rates. Any counterargument based purely on excess money makes no sense to me at all. And man, has there ever been more excess money than right now?
This is not investment advice. My optimism is tempered. A friendly reminder that this is still an Illusion of Prosperity blog. The meowing twenties could easily become the hissing thirties. Sustainable and stable is not the long-term path we find ourselves on. Each economic crisis has been worse than the last.


 Posts
Posts