I live in the USA and I am concerned about the future. I created this blog to share my thoughts on the economy and anything else that might catch my attention.
This is the End and a New Beginning
-
I've been thinking about this for some time.
After 21 years of writing this blog almost daily, I've decided to stop
writing the daily updates on the blog.
...
Silver Deep Dive
-
Silver had a memorable year (+148%). Some of this can be explained by a
decline in the dollar. I decided to do some ML analysis to look for other
insights....
Although public pension funds staked only tiny portions of their multibillion-dollar portfolios on Facebook's fortunes, the stock's poor performance has added to the funds' woes. Chronic underfunding and poor returns could lead pension funds to pursue riskier investments such as hedge funds, private equity, commodities and real estate, or even cut benefits for retirees.
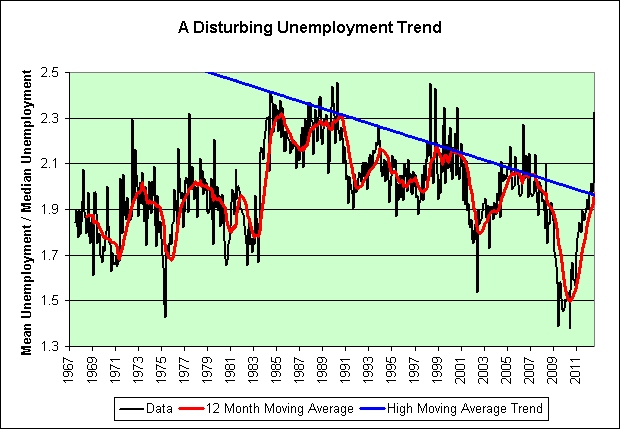
As seen in the red trend line, the data was extremely predictable from 1992 to 2001. That was true right up until it wasn't. That brings us to the chaos trend line in blue. Note the drop in correlation from 0.91 to just 0.19. Much of it is due to the data being so noisy. I trust this new upward trend about as much as I would trust random dartboards.
I don't think most companies have a clue as to how much short-term inventory they should keep on hand now, any more than I would. There are too many distortions in this economy to know what the future will bring. If they are making a mistake here, wouldn't it be nice to know in which direction?
That brings me to the next chart. It shows the deviation from the trend lines in the first chart.
Click to enlarge.
The dotcom bubble created quite the surprise. We moved quickly from the red data to the blue data. It was a paradigm shift. Previous assumptions proved invalid. There was way too much inventory for what was coming.
The housing bubble also apparently created quite a surprise. The chart implies that it shouldn't have, but that's another story. Once again, there was way too much inventory for what was coming.
Based on where we are now, I'd say that the danger level has been reset. Is there too much inventory for what is coming? I tend to think so.
I was extremely active this month. The weather's been great. I climbed to Poo Poo Point 4 times in just 6 days (1650' elevation gain each time). That's in addition to this plan's 20 extra flights of stairs each day. I took our dog on one of the trips. I would have taken her more but her feet needed time to recover.
I climbed to Poo Poo Point in just 56 minutes and 30 seconds the last time I tried. I *really* pushed myself. That was nearly 12 minutes off my fastest time (just 6 days previously). I was rewarded with one of these, big time.
I've also been climbing more than the minimum 20 flights of stairs on most days. I've been tending to do five at a time during TV commercial breaks. The doesn't mean I'm going to change the plan though. There are days when I only do 20 and I like having the bar set so low. There's no pressure to do more.
One would think that I would have lost more weight this month being so active. I think the extra exercise went straight to my appetite. I ate big meals after climbing to Poo Poo Point. Out of curiosity, I looked back to August of last year to see what I wrote.
Since I believe this has become a habit, I felt comfortable doing a couple of marathon runs this month (without the risk of burning out on the stair stepper). Last night I watched the movie Wasabi (subtitled) while stair climbing. That was good for over 200 flights (in addition to the 20 flights I did earlier in the day). It was a fairly leisurely pace. It made me hungry. I ate a large meal afterwards so I'm not sure I lost even an ounce overall, lol. That said, I was doing it as an alternative to just sitting on the couch while I watched the movie.
Fall appears to be the time of maximum exercise for me. It makes sense. My allergies tend to get me in the spring. Summer's too hot. Winter's too cold.
Here's the bottom line. This has definitely become a permanent habit. I'm very pleased with the results so far. I expect to eventually get to the blue zone and stay there. It will happen when it happens. Baby steps!
Given the large quantities people have to purchase, Costco customers have to be among the most confident of consumers.
As a Costco customer, I can't even begin to tell you how confident I am. If you really want to know, then I suppose you could start by reading more of my Illusion of Prosperity blog. It might offer a few subtle hints.
Its strong results also bode well for the reelection of President Barack Obama, whose pathway to victory might be paved by pallets of paper towels and toilet paper.
Paper towels and toilet paper for the win! But why is there no mention of garbage bags? As seen in the following picture, they are practically the stars of the economic show! They are packed with all kinds of petroleum goodness!
Compared to the current 0.05% yield on 3-Month Treasury Bills, isn't hoarding wonderful?
That 8.6% return on Costco garbage bags is now roughly 30%. I feel so much more prosperous now!
I would also point out that over the last 3 years the 0.05% yield on 3-Month Treasury Bills has skyrocketed to a whopping 0.10%. As you can imagine, that's really put a dent in my desire to hoard Costco goods. It also means that the economy is twice as good as it once was.
0.10% / 0.05% = 2
The room in the picture is now mostly empty. It won't stay empty. I have grand plans based on the resiliency of our economy. I'm clearing out the shelving and installing Costco's Ashbee Game Room Collection ($11,999.99)! This will allow me to gamble in the comfort of my own home and cut out the Wall Street middlemen entirely. And why not? I am incredibly confident that nothing bad will ever happen again. The Fed has permanently put a stop to recessions!
Cramer said investors could also asked their broker about buying bullion, which is the actual physical bars of gold.
I could also asked other things?
In all seriousness, English was never my best subject in school. I leaned much more heavily towards math and physics. Did something change overnight? Are there new rules I should be using?
“The end is near. I hear a noise at the door, as of some immense slippery body lumbering against it. It shall not find me. God, that hand! The window! The window!” = H.P. Lovecraft
“My concern,” he added in a June 2 letter to Capo, “is that the [the Alliance] wants to effectively eliminate the workforce through automation.”
While I can sympathize, that's what every company wishes to do and it has been going on since the invention of dirt (or at the very least the invention of the wheelbarrow).
The following chart shows U.S. manufacturing employees per capita.
Please ignore the highly correlated 2nd order polynomial trend line. That's just an artistic rendition of what could happen. We'll be far better off if nobody panics! Trust me on this one!
You sense urgency in my writing? No!! That's not it! Would I make this post a musical tribute if I wasn't incredibly optimistic about our future? More debt will give us more GDP! I'm almost sure of it! Just lose yourself in the moment. I have.
Update:
For the true optimists, here is another way of looking at the same data. This time I'll flip the axes and use an exponential growth trend line instead.
Click to enlarge.
One million dollars in inflation adjusted debt per capita here we come! Woohoo!
Oh yeah. That's what I'm talking about. We'll be so prosperous we won't even know what to do with ourselves, lol. Sigh. That's assuming there won't be an exponential trend failure at some point along the way of course. You know, like the one we already had. ;)
California again trumped other states with a $617 billion debt. California's debt is more than twice the size of New York's state debt, and New York has the second largest total debt burden in the nation. Texas, New Jersey, and Illinois rounded out the top five states with the most debt. Although New York and Texas moved up one and two spots, respectively, the states with the five largest debts remained unchanged from last year's report.
The states with the most people have the most debt? Shocking!
Vermont has the least amount of debt of all fifty states with a $5.8 billion state debt. North Dakota, South Dakota, Wyoming, and Nebraska follow Vermont with the smallest debt burdens in the country.
The states with the least people have the least debt? Shocking! Shocking I tell you!
I took the liberty of converting the total debt to total debt per capita (using the data within the link above combined with the state populations as seen here). This paints a slightly different picture.
New Jersey is the big loser with a whopping $32,013 debt per resident, followed closely by Alaska with $31,141, Hawaii with $29,062, and Connecticut with $27,540.
The winners are Nebraska with just $4,249 debt per resident, followed by Tennessee with $5,348, Indiana with $5,697, and Florida with $7,079.
Each year, Christie has achieved “on paper” budget balance by making inadequate payments into the state’s pension fund, effectively borrowing from the fund. Christie has touted this year’s $1.03 billion pension fund payment as the largest in the state’s history. Too bad the state’s pension actuaries told him to deposit $3.74 billion.
Investors who buy bonds issued by the state of Hawaii are not being compensated adequately given the risk presented by the state’s high unfunded pension liability and debt load, according to analysis by Barron’s, a weekly financial newspaper.
Ben Barnes, secretary of Connecticut's Office of Policy and Management, said by telephone that the expected rate of return is 8.5 percent for the teachers' fund and 8.25 percent for the other employees.
Connecticut's teachers' babies need new shoes!
Come on back to me 22. Come on back to me. Come on back. Come on 22, 22, 22.
Extrapolation of the expansion of the Universe backwards in time using general relativity yields an infinite density and temperature at a finite time in the past. This singularity signals the breakdown of general relativity.
The following chart shows the annual growth of total credit market debt owed (in dollars) divided by the annual growth in GDP (in dollars).
Click to enlarge.
As seen in the exponential trend failure in red, the bad news is that we will probably not return to the old normal.
As seen in the long-term sustainable trend in blue (growing our overall debts no faster than we grow our GDP), the good news is that we will probably not return to the old normal.
This chart does not imply that we all need to immediately build doomsday bunkers. On the other hand, this chart also doesn't imply that the debt-based "prosperity" growth engine of the 1980s, 1990s, and more than half of the 2000s will soon be repeated.
TRS officials in the past have disagreed with the notion that the 8.5 percent expectation is unrealistic or that it would lead the fund's managers to take unreasonable risks to attain that result.
Double your money every 8 1/2 years or bust!
1.085^8.5 = 2.00
How do you get to 8.5%? No problem! Start with a guaranteed 1.68% 10-year treasury bond and then add in something a bit more risky to make up the difference. What's the worst that could happen?
Reaching the blue trend line in the past meant that the wheels were about to fall off. I'm not sure why this was true but it is certainly something worth thinking about. It is also worth mentioning that we are back to the blue trend line. Fantastic.
The 1990 recession? Check.
The 2001 recession? Check.
The 2007 recession? Check.
I am willing to offer a theory. Looking at mean and median data can effectively hide underlying problems within our economy, and yet that is the data most mainstream economists choose to look at. In my opinion, there is some hidden data within this chart screaming to get out.
I bought 6 pounds of bananas last night at QFC. They were 64 cents per pound. They weren't even on sale. It would seem that hyperinflation theories have been poned yet another month.
As a side note, I love bananas. About a week ago I put a frozen banana in the blender, added a can of refrigerated vanilla Ensure, and then used the Smoothie setting for 30 seconds. I think it tastes awesome. It's like a thick, rich, banana milkshake without having all that fat. As an added bonus it is very easy on my stomach.
In the spirit of full disclosure, my girlfriend disagrees about the taste. *shrug shoulders*
If you decide to give it a try, let me know what you think. Surely I can't be the only person on the planet who likes it. It's a big planet, lol.
It is my opinion that we will *never* make it back to the real potential GDP line in blue, much less the exponential trends established from 1949 through 1999.
I am disillusioned enough to know that no man's opinion on any subject is worth a damn unless backed up with enough genuine information to make him really know what he's talking about. - H.P. Lovecraft
Since H.P. Lovecraft is my favorite author, I better supply more genuine information in his honor.
Click to enlarge.
It is my opinion that something bad will happen between now and 2028. Topping my list of bad things might be one or more of these. I know! That's just crazy talk!
To stabilize the economy and combat the 1970 inflation rate of 5.84%, on August 15, 1971, President Nixon imposed a 90-day wage and price freeze, a 10 percent import surcharge, and, most importantly, "closed the gold window", ending convertibility between US dollars and gold.
Behold the prosperity!
Anyone care to estimate what the new long-term growth rate will be?
Click to enlarge.
There's been no growth since 2000. You may wish to factor that into your estimate. Just sayin'.
This often rage-inducing saying is typically preceded by a blatantly honest statement that's likely to insult at least one person with it's cold, bitter truth.
1. The Fed will not be raising interest rates within the next two years.
2. We will return to the median trend line (in the chart above) within the next two years.
3. The interest rate on the 10-year treasury will therefore fall over the next two years.
I do not consider these predictions to be "sure things". As I've said before, I have no crystal ball.
That said, consider this.
Japan's 10-Year Treasury currently yields 0.84%. Our annual inflation rate has been 1.4% over the last 12 months but -0.8% over the last 3 months. Where is the pressure for the Fed to raise interest rates?
April CPI: 229.177
July CPI: 228.723
(228.723 / 229.177)^4 - 1 = -0.8%
The Fed claims it is on hold until the end of 2014. I see little reason to think otherwise. In fact, I think it will be longer than that. For example, what would happen if we have another recession between now and the end of 2014? I bring this up because I do not believe that the Fed has permanently put a stop to recessions.
Some Fed analysts said that the central bank could well extend the 2014 date into 2015 if the economy remains weak.
This time around, it would be refreshing if the pundit-political class considered a radical but obvious idea: tapping the multitrillion-dollar stockpiles of corporate cash currently sitting on the sidelines and benefiting no one.
Here's the obvious reply. Corporations might not need so much cash if they didn't have so much debt.
The following chart shows corporate cash as a percentage of corporate debt as seen in Table B.102 of the FRB's Flow of Funds Accounts of the United States.
Click to enlarge.
As seen in the chart, there is roughly $6 in corporate debt for each $1 in corporate cash. Put in this perspective, this is hardly the era of epic corporate cash hoards (Apple notwithstanding).
I can't speak for corporations but if I owed $60,000 on my credit cards and had $10,000 in cash then I probably wouldn't gamble with the cash unless I was extremely desperate. In fact, I might keep it as a safety buffer in case the economy got even worse.
There would be a temptation to pay off part of the credit cards. However, I'm not sure my situation would vastly improve if I only owed $50,000 but had zero cash. Things happen and those same things tend to hit the fan.
"The Man" would clearly prefer a legion of fully automated robots. That doesn't mean that there aren't exciting new career opportunities opening up to fill the gap though.
A retail day trader is a speculator who works for himself, or in partnership with a few other traders. A retail trader generally trades with his own capital, though he may also trade with other people's money.
Less comprehensive studies suggest that trading losses and costs for individual investors in the United States are about 2 percentage points a year (Barber and Odean, 2000, 2001). (U.S. individual investors trade less actively, but run a higher risk of trading with better-informed institutional investors.) Countries around the world are increasingly counting on personal investment accounts to fund their citizens’ retirements. Yet most individuals have no training in investments; many hold underdiversified portfolios and routinely make poor trading decisions. Over a savings horizon of 20 or more years, an annual return shortfall of 2 to 3.8 percentage points will result in a tremendous reduction in potential wealth.
Common Sense Theories
1. Advanced day trading tools provided by online brokers will never make the average day trader better than the average day trader.
2. Advanced day trading tools provided to retail investors will never match the trading tools of institutional investors.
If one believes that money will endlessly flow from bonds to stocks, then by all means chase the latest stock market rally.
Count me out. I chose to to permanently pass in the fall of 2004. If I was willing to watch the market rally without me then (which I was) it is just more of the same now.
It's been 8 full years since I turned permabearish. If this had been a healthy economy, then I would have missed out on some serious prosperity. As seen in the following chart, that's not exactly the kind of economy we have (or had) though.
Click to enlarge.
I can't say for sure when the next recession will hit, but I can say this. The evidence clearly shows that the Fed has not permanently stopped recessions from happening. They've been trying without success for 100 years. We've had 19 recessions under their watch. That's roughly 1 recession every 5 years. So here's a scary thought. In December, it will have been 5 years since the last recession began.
Not everyone is convinced that the stock market rally will hold up, of course.
Rick Weeks, a partner at HighTower Advisors in Vienna, Virginia, said that many of his clients "want to preserve their capital first," making them less interested in chasing rallies.
Here's a crazy thought. If one must own stocks then would it really be so bad to wait for the next recession and then buy them? How much longer can it be? Or are we really that impatient as a society?
To test the theory of a person's ability to delay gratification, the Stanford Marshmallow Experiment (1972), conducted by Prof. Walter Mischel, at Stanford University, California, studied a group of four-year-old children, each of whom was given one marshmallow, but promised two on condition that he or she wait twenty minutes before eating the first marshmallow. Some children were able to wait the twenty minutes, and some were not.
I am at the other end of the extreme. It is possible that I would still be collecting marshmallows if the test had continued. One million marshmallows? Yes!! Mwuhahaha!
3 per hour x 24 hours x 365.25 days x 40 years = 1,051,920
Severe obesity will double by 2030, when 11 percent of adults will be nearly 100 pounds overweight, or more, concluded the research led by Duke University.
Roman decadence is vividly portrayed in ancient literary sources and in depictions on vessels, frescoes, and mosaics. Feasting was a significant part of Roman society, so much so that satires were written mocking the frivolity of such affairs. Augustus (r. 27 B.C.-A.D. 14) attempted to control public and private gluttony by enforcing severe laws against extravagant menus or exorbitant spending for such events. But mere laws could not stifle the desire for delicacies and extravagant eating, especially among the elite of Roman society. The very people who established these laws were the first ones to break them!
After the slave revolt of Spartacus in 73 BC, the State assumed greater control of public games (ludi), and large numbers of gladiators were trained in imperial schools. (Interestingly, ludus means "game" and "school," because both required imitation and repetition.) Under the tutelage of a manager (lanista), a troupe (familia) of gladiators could be sold or hired out, and many were retained privately by politicians and wealthy citizens as bodyguards, especially in times of civil unrest.
This could never happen here of course. This isn't Rome; this is America!
1. Start with total annual wages and salary accruals.
2. Add in the annual change in total credit market debt owed.
3. Adjust it for inflation (June 2012 dollars).
4. Adjust it for population growth.
5. Ponder the real price of oil (June 2012 dollars).
6. Party like it's 1978.
The following chart shows declining manufacturing employment (in red) vs. increasing manufacturing output per person (in black).
Click to enlarge.
What do you get when you multiply them together?
Click to enlarge.
The correct answer is total manufacturing output.
Our judges would have also accepted exponential trend failure, one @#$%ed up economy, and/or holy @#$%. Unfortunately, this is not a game show. This is real life. Sigh.
Here’s a depressing thought: America’s productivity is rising on the backs of scared office workers.
Click to enlarge.
Note the two exponential trend failures. The first saw pessimistic exponential growth in layoffs and discharges. It eventually failed (after going parabolic!). The second saw optimistic exponential decay in layoffs and discharges. It too eventually failed.
I strongly believe that the next exponential trend on this chart will be one made of pessimism. I just can't say when it will happen. It might already be happening.
Click to enlarge.
When will the optimistic trend in quits fail too? I highly doubt that we will *ever* get back to 2.2% per month. Let's just put it that way.


