Monday, April 30, 2012

Stagployment

A reader sent me the following link and I just have to share it.

April 30, 2012
The Inflation Threat Is a Bogeyman

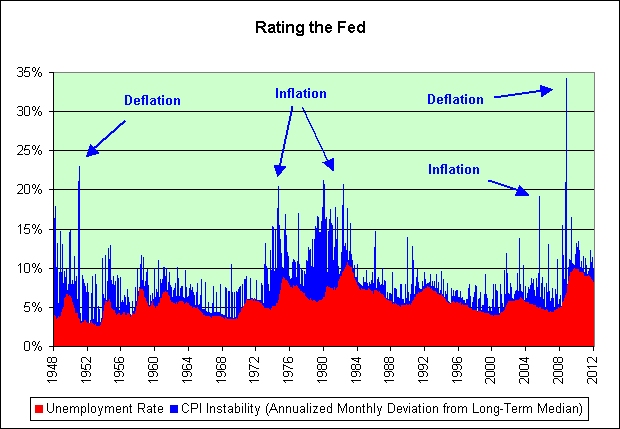
The conspiracy theory that inflation is being wildly under-reported doesn't withstand more than 30 seconds of scrutiny. So why the persistent belief that we're reliving the stagflationary nightmare of the 1970s when the deflationary nightmare of the 1930s is much more relevant?

I have stagflationary in my name and even I don't see stagflation. Of all people, you'd think I would be the most sympathetic to the conspiracy theory. I do see pathetic real growth, pathetic real yields, and pathetic job creation but I don't see runaway inflation. I track every penny I spend. It's just not there.

As a keeper of receipts, I offer this anecdotal data point.

I refer you to the sticker that was mounted to my Camry 4-Door XLE Sedan V6. In order to compare apples to apples I will remove all of the optional equipment.

Here's the 1996 model.

Camry 4-Door XLE Sedan 3.0 Liter V6, MSRP: $25,038.00

Here's the 2012 model.

2012 Camry

Camry 4-Door XLE Sedan 3.5-Liter V6, MSRP: $29,845.00

Let's ignore quality improvements (note the larger engine on the new model) for a moment and just talk about the 19.2% price increase spread out over 16 full years.

That's an average price increase of 1.1% per year on a large purchase that most Americans very much seem to cherish.

Now let's talk about what the price would be if inflation had really been 10% per year.

$25,038 x 1.1^16 = $115,048

So here's my question for the CPI conspiracy theorists.

How many Camrys would Toyota sell this year in America if they raised the price to $115,048?

Now let's see what the government says new car prices have done.

In April 1996 (the month I bought my car), the new car index was 140.8. As of March 2012, it stands at 143.702. That's an average annual increase of 0.1% per year. At best, the government is under-reporting new car inflation by 1% (the difference between the 1.1% I see and the 0.1% the government sees). That hardly gets you to 10% inflation though.

Would anyone really dispute that new cars of today haven't gotten better by the 1% per year the government seems to be claiming? Seriously?

Let's go back to that engine discrepancy. My car has a 3.0 liter V6 185 horsepower engine. The new car has a 3.5 liter V6 268 horsepower engine. For those keeping track at home, that's a 45% increase in horsepower. Amazing. The government claims that I should have to pay more for a more powerful engine. Why would I disagree? I paid extra to get the V6. It was worth it to me. That's just for starters. I don't think it is hard to imagine other improvements that have been made in the last 16 years.

2012 Toyota Camry Performance

"The four is strong in this car, so there's no reason for the V-6 take-rate to go up." -- Motor Trend

The 2012 XLE V4 has 178 horsepower, which is just 7 horsepower shy of my 1996 XLE V6. It gets 25% better gas mileage in the city than mine too. Further, its MSRP ($24,725) is lower than what I paid 16 years ago. So you tell me where the inflation is in new car prices and we'll both know.

It isn't inflation if you get a 20% better car for 20% more money. In fact, we do that every time we purchase a car. "I like this one but that one is 20% better. Should I pay 20% more for it?" It's not always an easy decision.

It stinks if you cannot afford the new car with added features and improvements, but that's not an inflation problem. That's a wage problem. Let's stick to what the problem really is. For a variety of reasons, wages are stagnating.

It's not stagflation. It's stagployment.

In my opinion, we're going to be stuck with it for a very, very long time. Sigh.

More Thoughts on Johnson & Johnson

Last year I posted the following chart and offered some thoughts to go with it.

August 23, 2011
Thoughts on Johnson & Johnson

Click to enlarge.

Here's an updated chart that includes 2011's results.


Click to enlarge.

Note that I've added an exponential trend line for real earnings per share. Are those the trends you'd like to see during a supposed economic recovery?

That said...

Perhaps they come up with a cure for cancer. There's no doubt that would make the company a spectacular investment.

Perhaps they have similarly wonderful things in their pipeline that an investor with time on his/her hands could explore.

Perhaps the exponential trend line failures are merely temporary and are simply due to one-time events.

Perhaps changes in the exchange rate will boost their future results.

Perhaps they have grand plans for acquisitions.

Perhaps they can convert their high grade AAA rating into a low grade BBB rating while simultaneously buying back a @#$%load of shares. Most investors seem to love that. It would certainly boost both sales and earnings per share.

I'm serious. All of those things are certainly possible.

In any event, I shall pass and I am clearly in the minority.

Motley Fool : Johnson & Johnson

Outperform: 13,518 players
Underperform: 486 players

What are the odds that 96.5% of investors are wrong? The math would say 3.5%. I've got a feeling the odds are somewhat higher though. 5%? 10%? I am not at all tempted to short the stock but I would be tempted to short a herd (if given roughly 30-1 odds anyway).

I want to be perfectly clear. I have not dug through the annual reports in detail. Please do not consider this limited research to be anything even remotely similar to due diligence. I can say this though. These charts do not inspire me to dig any deeper.

Source Data:
Johnson & Johnson: Investor Relations
BLS: CPI

The "Free Lunch" Weight Loss Plan v.011

I continue to climb 20 extra flights of stairs each and every day.


Click to enlarge.

The chart was flat this month.


Click to enlarge.

It has been my goal to be within the blue zone within the time frame of this chart and to do so with the least amount of effort possible. It's a long-term lazy person's approach.

I've never actually tracked my weight over this long of a time period. I therefore don't yet know how strong the seasonal effects are. All I really know is that I am more active in the summer and tend to eat differently when it is hot.

In theory, the seasonal effects should put me in tailwind mode for the next 6 months. The low point on the chart was hit around Halloween.

June is where the real action begins. That's when I'll finally start to see year over year results. That data should therefore be entirely free of seasonal effects. I suspect that the seasonal effects are strong, but probably not as strong as this chart implies. Some of the decline in the first few months could have easily been a subconscious desire to lose extra weight. In the past, the first few pounds always seemed the easiest to lose.

In any event, it is a permanent habit now.

335 days x 200 feet (20 flights) = 12.7 miles

It does add up. Although it is just a few minutes per day, I can feel it in my legs.

See Also:
The "Free Lunch" Weight Loss Plan v.000

Sunday, April 29, 2012

Employee Hours (Musical Tribute)


Click to enlarge.

The Jetsons

George Jetson: age 34, is a loving family man who always seems to make the wrong decision. He works "full-time," 9 hours a week, at Spacely's Sprockets as a computer engineer.


See Also:
Capitalist/Socialist Utopia!

Source Data:
St. Louis Fed: Nonfinancial Corporations Sector: Hours

Bent-up Demand (Musical Tribute)


Click to enlarge.

Broken.


Click to enlarge.

Bending.


Click to enlarge.

Bent-up.

February 8, 2011
Pent-up Housing Demand Will Soon Rip Loose

Once financing becomes more available, he expects to see a “tsunami” of home sales as the pent-up demand is finally expressed.


Click to enlarge.


Source Data:
St. Louis Fed: Residential Investment Custom Chart
St. Louis Fed: Household Debt Custom Chart
St. Louis Fed: Oil Custom Chart
St. Louis Fed: New One Family Houses Sold

How Can Any Rational Person Be Optimistic about Our Long-Term Economic Future?


Click to enlarge.

1. The exponential trend lines are based on the data from 1959 through 1999. If that was our truly prosperous era, then why did we require exponentially increasing net government borrowing (relative to our wages)?

2. The long-term exponential trend for expenditures exceeds the long-term exponential trend for receipts. Who thinks that will end well?

3. We seem shocked that our government is spending so much. Should we be? Current federal government expenditures (in black) sit right on the trend line (in red) that was established before our recent economic crises even began.

4. Who really thinks we'll be sitting pretty if federal government expenditures reach 100% of wage and salary disbursements someday? If these trends established between 1959 and 1999 continue then that would happen in the year 2067. There's no way we'd make it that far though. Things would clearly fall apart well before then.

5. The last decade of economic calamity certainly hasn't made the trends any better. The exponential growth trend in federal government receipts has failed miserably. As a percentage of wage and salary disbursements, we're now at 1980 levels.

6. Dare I mention Social Security and Medicare?

Social Security heading for insolvency even faster

WASHINGTON (AP) — Social Security is rushing even faster toward insolvency, driven by retiring baby boomers, a weak economy and politicians' reluctance to take painful action to fix the huge retirement and disability program.

The trust funds that support Social Security will run dry in 2033 — three years earlier than previously projected — the government said Monday.

Source Data:
St. Louis Fed: Custom Chart

Saturday, April 28, 2012

Rating the Fed

There are many ways the Fed could be rated. This is simply my attempt based on the dual mandate of maximum employment and price stability.


Click to enlarge.

Start with the unemployment rate. That's the easy one. It's just the area in red. The less red the better.

Now compare the amount the CPI changes in the given month to the typical amount the CPI changes in a month (the median change is roughly +0.26%), then annualize the difference. This is the blue CPI instability part of the chart. Stack it on top.

For example, in November of 2008 the @#$% hit the fan. The CPI dropped 1.79% that month. The CPI typically rises 0.26% per month (+3.2% annualized). The difference was therefore 2.05%. Annualized that's 27.6%. Oops!

As far as my rating system is concerned, the goal for the Fed is to minimize the combination of the two. Needless to say, they haven't been doing great in recent years.

I should also point out that the Fed doesn't actually give us price stability. All we get, at least in theory, is price predictability. I'd settle for that if they can deliver. The last thing anyone needs right now is even more uncertainty and chaos.

And lastly, as of January the Fed claims that their inflation target is now 2.0%. That works out to +0.17% per month. Seeing as how they've overshot the target in both February (+0.41%) and March (+0.29%), I think I'll stick with the median value until I see more evidence. Talk is cheap.

Source Data:
St. Louis Fed: CPI
St. Louis Fed: Unemployment Rate

Inflation Can't Create Jobs, Part 2

Yesterday I posted the following 2 charts.

April 27, 2012
Inflation Can't Create Jobs

Click to enlarge.


Click to enlarge.

I pointed out there was no correlation between the rate of inflation and the unemployment rate. I stand by that claim. That's what the math shows.

I figured out a way to create some correlation though. Let's go back to that first chart and annotate it.


Click to enlarge.

Here's my claim. First the inflation hits, then the unemployment comes as the Fed is forced to fight it. I have circled the relevant pairs that would support this theory. As a side note, it would seem that the Fed didn't realize its own strength in the most recent fight. In hindsight, they whacked the @#$% out of it.

Here's what the chart looks like when we offset unemployment by 41 months. In other words, the inflation you see in the chart is paired with the unemployment rate that comes 41 months later.


Click to enlarge.

Why 41 months? That's the time frame that gave the strongest correlation in the following chart.


Click to enlarge.

So what does this mean? It is my opinion that inflation is not a free lunch. If you want extra inflation now then you will pay for it roughly 41 months later (give or take), lest we run the risk of a currency crisis and/or hyperinflation.

September 2003
NBER WORKING PAPER SERIES: INFLATION TARGETING IN THE UNITED STATES?

The Volcker disinflation made particularly clear why it is so costly to restore credibility for low inflation once it has been compromised.

It was apparently not clear to Gregory Mankiw. He was perfectly willing to have the Fed destroy the credibility of US legal tender by drawing a number randomly from a hat.

Source Data:
St. Louis Fed: Unemployment Rate
St. Louis Fed: CPI

Friday, April 27, 2012

Inflation Can't Create Jobs


Click to enlarge.

As seen in the chart, there is no correlation between the inflation rate and the unemployment rate.

Here is an alternative way to look at this same data. I'm plotting the inflation rate compared to the average inflation rate and the unemployment rate compared to the average unemployment rate.


Click to enlarge.

Do you see correlation in that chart? Maybe you do. How sure are you? Here's that same data plotted on a scatter chart.


Click to enlarge.

There is no correlation (neither positive nor negative). That's what the math says. Whatever pattern you think you see is undone by the patterns you don't see.

See Also:
The Failed Keynesian Phillips Curve

Source Data:
St. Louis Fed: Unemployment Rate
St. Louis Fed: CPI

Our Unendurable Economy


Click to enlarge.

So many exponential trend failures. So little time.

Speaking of unendurable, here's a two-year chart of Ford vs. GM.

Yahoo Message Board: Ford...Is it really that bad??????

Lets see...They said once ford became investment grade the stock would soar....they said once F starting paying a dividend again it would skyrocket...they said once F shows earnings above the estimates and sales above the est that it would do nothing but soar. Well all of those things happened and the stock is down 38% from its highs and down 12% lower than 2 weeks ago.

Can someone really tell me what the fk is going on. I am ready to bail on this so called great buy. I dont want to hear about Europe or bad management, the best I can tell Mulally has done an excellent job considering they took NO gov. money and recovered on their own.

Source Data:
St. Louis Fed: Custom Chart

The GDP Dog and Pony Show Update (Musical Tribute)

April 26, 2012
Q1 GDP report seen as workhorse, not show pony

WASHINGTON (MarketWatch) — If the first-quarter gross domestic product report is an animal, then economists say it’s more a workhorse than a pony.


Click to enlarge.


See Also:
The GDP Dog and Pony Show

Source Data:
St. Louis Fed: Real GDP

Thursday, April 26, 2012

Retail Sales Employee Bubble (Musical Tribute)


Click to enlarge.

All it took was a bit of magic.

What would a reduction or elimination of silver content of our coins mean to you? The answer is that unless you're a coin collector or a hoarder, it would mean NOTHING. As for speculators, they should be fully aware that the Treasury is determined to hold silver's price where it is to prevent the melting down of existing coins for their silver content.

Oh Silvia Porter! What were you thinking!

CLIFF RICHARD - Devil Woman (1976)


I've had nothing but bad luck
Since the day I saw the cat at my door
So I came in to you sweet lady
Answering your mystical call

Crystal ball on the table
Showing the future the past
Same cat with them evil eyes
And I knew it was a spell she cast

Give me the ring on your finger
Let me see the lines on your hand
I can see me a tall dark stranger
Giving you what you hadn't planned

I drank the potion she offered me
I found myself on the floor
Then I looked in those big green eyes
And I wondered what I came there for

If you're out on a moonlit night
Be careful of the neighborhood strays
Or a lady with long black hair
Trying to win you with her feminine ways

Crystal ball on the table
Showing the future the past
Same cat with them evil eyes
You'd better get out of there fast

Source Data:
St. Louis Fed: Custom Chart

The Death of Nominal Yields (Musical Tribute)


Click to enlarge.


Source Data:
St. Louis Fed: Custom Chart

The GDP Dog and Pony Show

April 26, 2012
Q1 GDP report seen as workhorse, not show pony

WASHINGTON (MarketWatch) — If the first-quarter gross domestic product report is an animal, then economists say it’s more a workhorse than a pony.

March 10, 2012
Cracks in the Dam

Click to enlarge.

Dog and Pony Show

The term has come to mean a highly promoted, often over-staged performance, presentation, or event designed to sway or convince opinion for political, or less often, commercial ends. Typically, the term is used to connote disdain, jocular lack of appreciation, or distrust of the message being presented or the efforts undertaken to present it.

Wednesday, April 25, 2012

For Peat's Sake!

April 24, 2012
Peat-bog thieves caught in Moscow region

Police raided the peat-bog gang and confiscated 14 trucks, 19 pieces of construction equipment, two helicopters and a plane, Interior Ministry website said.


Click to enlarge.

Nobody ever claimed that the infamous peat-bog gang was there to make a killing.


Source Data:
USGS: Historical Statistics for Mineral and Materials Commodities
St. Louis Fed: CPI

The Sarcasm Report v.157

April 25, 2012
How Should I Safely Diversify to Beat Inflation?

As you can imagine, I could not wait to hear the advice of a real life Ph.D., CFA, CFP! I immediately grabbed my checkbook as the excitement welled up within me.

1. He shot down federally insured bank accounts claiming that they won't do much to protect against inflation. Makes sense.
2. He shot down TIPS due to their negative real yields. As a holder of TIPS, I have no choice but agree with the math. It stinks.
3. He offered I-Bonds as a choice. Not sure how they can safely beat inflation with a 0.0% real rate and with the added pain of paying tax on any inflationary gains. But hey, it is the best choice so far. I'll give him that. Unfortunately, he got the $5,000 limit wrong. It's now $10,000. A glimmer of anti-hope (cynicism) formed in my brain.

So guess what was offered as an alternative?

Nothing. The article just sort of ended. It was at this point that I put down my checkbook and sighed in despair. The question of where to "safely" beat inflation will apparently continue to remain a mystery for both myself and the 79 year old reader looking to protect his principal. Or will it?

Once you eliminate the impossible, whatever remains, no matter how improbable, must be the truth. - Sir Arthur Conan Doyle

The only way to safely beat inflation is to do absolutely nothing? In that case, I'm cashing out everything and investing in nothing. Paper dollars, shovels, and backyards for the win! Sherlock Holmes! You are a genius!

This concludes today's sarcasm report.

Peak US Copper Consumption?


Click to enlarge.

I offer two trend lines for your consideration.

APPARENT CONSUMPTION = PRIMARY PRODUCTION + SECONDARY PRODUCTION + IMPORTS – EXPORTS ± STOCK CHANGES

August 11, 1941
COPPER UNDER FULL CONTROL

In the future, sales or transfers of metal by producers to their subsidiary or affiliated companies and even by one division of a single company to another will be subject to control by the director of priorities. It is clearly understood by the fabricators that their products will be subject to priorities also. Non-defense orders will be accepted on an "if and when" basis.

It is questionable if defense orders will take up the capacity on some of the products of the fabricators, but getting copper for non-defense uses will be another matter. Even fabricators with defense orders are having their problems.

See Also:
Trend Line Disclaimer

Source Data:
USGS: Historical Statistics for Mineral and Materials Commodities

Drowning in Aluminum


Click to enlarge.

Exponential trend failure! Let's step back and see how bad it really is.


Click to enlarge.

Nasty! The aluminum speculators must have loved this break in the trend. We're not growing global aluminum production anything like we once did. And as an added bonus, the Fed is doing all it can to support prices! Let's see how it is going.


Click to enlarge.

What? Aluminum prices haven't been keeping up with inflation? Just something to think about if you are long commodities and/or fear hyperinflation. The Fed might be creating money out of thin air but the mining companies have been plenty busy attempting to meet our nearly insatiable demand as well. Our demand apparently does have limits. You probably won't hear this from a commodities trader these days though.

April 16, 2012
The Next Global Crash: Why You Should Fear the Commodities Bubble

Investors have gone crazy for commodities, pouring money into everything from oil to copper. Just like the world's mania for tech stocks in the 1990s, this boom is headed for a bust.

For what it is worth, I think it is a distinct possibility. I wouldn't bet the farm on this theory but I wouldn't rule it out either. There's also an issue of timing. When will it bust? You tell me and we'll both know. Perhaps it depends on China.

April 17, 2012
The Ghost Malls of China: Inside a Commercial Real Estate Bubble

And the overcapacity isn't limited to real estate. Chinese industry has been churning out massive amounts of steel, cement, and aluminum -- so much that there are doubts about the economy's ability to absorb the output.

Source Data:
USGS: Historical Statistics for Mineral and Materials Commodities
Kitco: Base Metals Charts and Graphs
St. Louis Fed: CPI

Tuesday, April 24, 2012

Our Dying Growth Engine


Click to enlarge.

October 6, 2011
Housing Can Be 'Key Engine of Job Growth'

The housing industry can be the “key engine of job growth” the country needs, says Bob Nielsen, chairman of the National Association of Home Builders.

Then again, maybe not.

1973 oil crisis

The 1973 "oil price shock", along with the 1973–1974 stock market crash, have been regarded as the first event since the Great Depression to have a persistent economic effect.


Click to enlarge.

Source Data:
St. Louis Fed: Custom Chart
St. Louis Fed: Spot Oil Price: West Texas Intermediate

Basic Sarcasm for Finding Cheap Stocks

April 18, 2012
Basic Metrics for Finding Cheap Stocks

If you had to pick just one method for determining whether or not a stock is cheap, the Price to Earnings, or P/E ratio, would have to be right at the top of the last.

Speaking of top of the last...

Corporate Profits / Wages

Click to enlarge.

Earnings better not Freudian slip!

Monday, April 23, 2012

Quote of the Day

April 23, 2012
How to Beat Wall Street -- With Social Security

But for Social Security to adjust, Congress must act. The plan's current math uses a return assumption that dates to 1983. It assumes investors can easily find risk-free investments that pay 2.9% after inflation.

Welcome to the 21st century!

Modern Inflation


Click to enlarge.

April 16, 2012
Fed’s Bullard tells Utah State crowd 2 percent inflation target is paying off in growth

Bullard said the committee’s January 2012 choice to publicize a target inflation of 2 percent was an important step toward maximizing employment and stabilizing prices to allow Americans to enjoy a comfortable balance between having enough money and the leisure time enjoy it.

The chart does make one wonder if the previous inflation target was 2.5%. In any event, I'm in favor of the 2% inflation target. It won't miraculously generate more prosperity for us, but as a saver it is better than a sharp kick in the teeth.

See Also:
MaxedOutMama: Who Wears Short-Shorts?

Source Data:
St. Louis Fed: CPI

Saturday, April 21, 2012

Quote of the Day

April 20, 2012
Earnings, Fed to prove skeptics wrong

Kenneth Fisher, the billionaire investor who oversees $43 billion at Woodside, California-based Fisher Investments Inc, said the current economic environment was "as beautiful as I have ever seen it," and that 2012 would be "a super big year" for equities.

Don't you see what this means? Even with an 8.2% unemployment rate and $100+ oil, the economy is at least as good as it was back in 2007!

February 26, 2007
Housing Boom! - Ken Fisher

Don't buy it. For months now the debate has been over whether America will have a hard landing or soft landing, the answer hinging on how big 2007's housing disaster turns out to be. Well, there won't be any housing disaster. We won't have a landing at all, soft or hard. Right now the U.S. and global economies are both accelerating.

You can see right through the housing crash story by looking at the prices of housing stocks. The market knows what the economic worrywarts do not, which is that the housing sector is already making a comeback. In the last six months housing stocks are up 24%, well ahead of the overall market. If housing were destined to fall apart in 2007 these stocks wouldn't be so strong now.

Friday, April 20, 2012

Exponential Trend Failure Chart of the Day


Click to enlarge.

Shocking! Other than a few fringe bloggers with little to no formal economics training, who could have possibly seen this exponential trend failure coming? Just look at it. It's as smooth as a baby's bottom!

So what if 100% means we'd be shipping every penny of every paycheck overseas (with nothing left to eat or pay taxes)? As seen in the chart, that wasn't supposed to happen until 2017. This is only 2012!

Forehead. Desk. Whack. Whack. Whack.

See Also:
Savvy Chinese Know Exactly When Bubble Will Burst!
Savvy Chinese Find Market Top!
Trend Line Disclaimer

Source Data:
St. Louis Fed: Custom Chart

Expected Return of Capital


Click to enlarge.

I'm using the bond market's 20-year TIPS to nominal treasury spread to estimate the expected inflation rate. You cannot see the 20-year treasury in this particular chart because the 20-year TIPS exactly covers it up.

The EE Savings Bonds offered today are guaranteed to double in price in 20 years. You can see that in the chart.

The 2.28% inflation rate is not locked in stone. In other words, the bond market could be wrong and most likely is.

Here's what happens at 1%.


Click to enlarge.

Here's what happens at 5%.


Click to enlarge.

Here's what happens at 10%.


Click to enlarge.

I'm not predicting 10% inflation. I own inflation protected bonds as insurance. Similarly, I don't think my house will burn but I do have fire insurance.

Also note that owners of inflation protected bonds should not root for more inflation. The higher inflation goes, the less capital is protected (due to the taxation on the inflationary gains).

This post inspired by Troy who brought up return of capital in a recent comment.

Source Data:
Treasury Direct: I Savings Bonds Rates & Terms
Treasury Direct: EE Bonds Rates & Terms
US Treasury: Yield Curve

Thursday, April 19, 2012

Quotes of the Day!

April 19, 2012
Car Makers Still Look to China

China has "already got overcapacity that's about equivalent to the size of the entire German market," said Mr. Thomson.

Meanwhile, over at planet Jim Rogers...

April 19, 2012
Jim Rogers On When To Buy Gold, Chinese Bubbles And Fake Good News

China will certainly be the largest producer and consumer of automobiles in the next several years. I don’t know how much they will produce or consume.

I've never seen a more uncertain certainty argument.

But if anybody thinks there’s a bubble in China, they haven’t been doing their homework. The bubble popped. Prices have come down and are continuing to come down.

There was this bubble you see. And it popped. But don't go calling it a bubble now because prices have come down and they are apparently continuing to come down, lol.

I shorted Treasury bonds again a little while ago, and my timing has never been very good in that market. I’m down a little bit, not much.

July 7, 2011
Jim Rogers Says He's Shorting 30-Year Treasury

Jim Rogers, the noted commodity bull, is shorting the 30-year U.S. government bonds and may consider shorting the 5 and 10-year bonds as well, he told CNBC on Monday.

30-Year Treasury Yield (7/7/2011): 4.37%
30-Year Treasury Yield (4/19/2012): 3.12%

For those keeping track at home, that's a 1.25% loss each year for 30 years. He managed to squeeze all of that "sure thing" pain into just 9 months though, much like an expectant mother.

Baby needs new shoes!


St. Louis Fed: 30-Year Treasury

Click to enlarge.

Real GDP vs. CPI

Summer 2005
GE Asset Management: The “Real” Story About Treasury Inflation-Protected Securities (TIPS)

Please see "Figure 5 - When to Buy TIPS" from within the link. I'm attempting to recreate the theoretical table with actual historical data.


Click to enlarge.

Growth rates are year over year.

This is not a sales pitch for TIPS. I'm simply trying to show why both TIPS and nominal treasuries have done well over the past decade. We've been toggling back and forth between Stagflation: BUY and Recession Disinflation: Monetary Policy Drives Call. What happens in the future will depend on where new blue diamonds appear within the chart.

Based on my blog's name, you might guess that I'm not betting on the "miracle" quadrant.


Source Data:
St. Louis Fed: Real GDP
St. Louis Fed: CPI

Wednesday, April 18, 2012

Toilet Paper News

I offer this outstanding news for those who hoarded the same toilet paper that I did. We no longer need to worry about productivity miracles making our hoards seem silly.

November 2, 2009
8.6% Return on Investment!

Click to enlarge.

See that toilet paper hoard off to the right? That's Georgia Pacific's Marathon brand purchased at Costco.

A recent purchase was accidentally opened by my girlfriend. We normally use oldest first. That did allow me to compare the newest rolls to our oldest rolls.

The rolls were slightly different sizes (which I knew) but something felt wrong about the actual sheets. I felt a bit like the Princess in The Princess and the Pea. I therefore decided to take two rolls to the kitchen scale.

The new package has 4.0" x 4.5" sheets.
The old package has 4.0" x 4.5" sheets.

No change there.

The new package has 48 rolls at 470 sheets each.
The old package has 45 rolls at 500 sheets each.

No meaningful change there.

The new roll weighs 174 grams and has 470 sheets.
The old roll weighs 200 grams and has 500 sheets.

The cardboard tube weighs 5 grams.

The new sheets therefore weigh 0.36 grams each (169 / 470).
The old sheets therefore weigh 0.39 grams each (195 / 500).

Very clever. I seem to be getting about 8% less toilet paper per sheet and nobody is the wiser.

Well, that's not quite true. At least one person is the wiser now and if he tells two friends, and if they tell two friends, and so on, and so on, then perhaps nearly everyone can be the wiser.

In any event, I would argue that the majority of my toilet paper hoard just went up in value by about 8%. Woohoo! I feel so much richer now!

November 9, 2011
How to Find the Best Deals on Toilet Paper

Find the Total Square Feet number on the package. Then divide it into the price that the package costs.

The weight of each sheet should also be factored in apparently, unless of course you would enjoy watching TV through a sheet of 2-ply toilet paper someday, lol. Sigh.

The Illusion of Prosperity is alive and well. Good times.

The Pain in Spain (Musical Tribute)

October 1, 2007
Spain's Pain?

Spain has reassured us all that any adjustment is ridiculous, unthinkable, completely out of the question, that they have one of the most efficient financial systems in the world, and that it is immensely solid as well. Why worry?


Click to enlarge.


See Also:
David Taguas vs. Vizzini
Rafael Pacheco vs. Ash
Europe vs. Ash

Source Data:
St. Louis Fed: Total Retail Trade in Spain

Daring and Bold Prediction!

Quick! Someone find me an optimist. I'm looking to place a bet!


Click to enlarge.

We will never see 80% again.

That's right. I don't have any long-term faith in my own trend line. Oh the humanity!

I could be wrong of course. Perhaps the economy is so strong that we can go 15 more years without a recession?


See Also:
BLS: Job Openings and Labor Turnover Summary
Trend Line Disclaimer

Source Data:
St. Louis Fed: Custom Chart

Industrial Production (Musical Tribute)


Click to enlarge.


So any time you're feelin' bad
'stead of feelin' sad
Just remember that ram

Oops, there goes a billion kilowatt dam

All problems just a toy balloon
They'll be bursted soon
They're just bound to go pop

Oops, there goes another problem kerplop

Kerplop!

Source Data:
St. Louis Fed: Industrial Production Index

Tuesday, April 17, 2012

Japan's Economy

In an effort to keep the exponential trend in exponential trend failure charts alive, I present you with the following chart.


Click to enlarge.

Ouch.

April 17, 2012
Japanese Engineers Find New Life in China

Sony, Panasonic and Sharp — Japan’s three main TV manufacturers — are expected to have lost $21 billion between them in the fiscal year that ended March 31, partly because of Korean competition.

Many of the Japanese engineers finding a second life in China do not have the expertise in cutting-edge technology that would deal another crushing blow to Japanese manufacturers, analysts say, but the long-term impact could be severe because they will give Chinese manufacturers the skills to make high-quality goods efficiently.


Ouch.

See Also:
Retail Sales vs. Money Supply

Source Data:
METI: Current Survey of Commerce
MIAC: Consumer Price Index

Retail Sales vs. Money Supply


Click to enlarge.

The linear trend line in blue is for those who think the growth in the money supply should have a direct effect on the growth in retail sales. One might call this group the optimists. They hope for a return to the blue trend line and all will be well when it does.

The logarithmic trend line in red is for those who think the growth in the money supply is having a diminishing "bang for the buck" effect on the growth in retail sales. One might call this group the pessimists. They brace for a return to the red trend line and all will fall apart when it does.

Based on the correlation seen in the trend lines, I'd say the pessimists have the stronger case.

I am between the two camps, with a decidedly pessimistic bias. I do not think the Fed has permanently removed the possibility of recessions. I would also not want to be an optimist when the next one hits (whenever that is).


And lastly, there's one group left. The hyperinflationists seem to think that not only will we make it back to the blue trend line but we will surpass it with great abundance. $10 trillion in monthly retail sales here we come! And when might this happen? If history is a guide, it is *always* a few months away. You just need to be extremely patient!


See Also:
Trend Line Disclaimer

Source Data:
St. Louis Fed: Real Retail and Food Services Sales
St. Louis Fed: Retail Sales (Discontinued Series)
St. Louis Fed: MZM Money Stock

Monday, April 16, 2012

Real Yields vs. Inflation

In the past, I have claimed that owning TIPS allows me to be somewhat of an inflation agnostic. I now have a chart to back the theory.


Click to enlarge.

Note that there is *no* correlation between 10-year TIPS real yields and what inflation has done over the previous year.

In my opinion, the story of falling real yields has nothing to do with inflation and everything to do with a long standing theory of mine.

It will be harder and harder to make easy money off of money.

That's what the chart shows. We can try deflation again if we like. We can opt for more inflation too. In the long run, it will not matter. Call me an economic cynic.


Cynicism

They believed that the world belonged equally to everyone, and that suffering was caused by false judgments of what was valuable and by the worthless customs and conventions which surrounded society.

There's certainly been plenty of suffering in the last decade based on what people thought was valuable. In sharp contrast, and as accurately portrayed in the following picture, I honestly believe that the best things in life are free (or nearly free).


There's a story behind our dog Honey. I don't think I've shared it before.

Some people went to an animal shelter and picked out a new dog. They brought it home. Unfortunately, the dog was pregnant and nobody realized it. Upon giving birth to the oddest assortment of puppies one would ever see (multiple fathers?), they called the animal shelter and asked what they should do with the puppies. They were told that it wouldn't be a problem. Just bring the puppies back. How could the puppies be separated from the mother that soon? Once again, not a problem. The puppies would be euthanized.

Needless to say, we ended up with a free puppy (and the other puppies found homes too). Honey's about 8 years old now. As for the couch, it is now in our kitchen and has quite a few claw marks on it. Contrary to "worthless customs and conventions" of most humans, our dog still finds value in it (and we do too apparently).

Source Data:
St. Louis Fed: Custom Chart

Port Traffic Bounces Back

Before you get out the party hats, some perspective is probably in order. Last month was very bad. So on that note, here's the fresh data.


Click to enlarge.

Note how far away from the exponential trend line we are. There is no hope of getting back to it.


Click to enlarge.

On the one hand, exports are looking good.


Click to enlarge.

On the other hand, look at the collapse in total port traffic relative to the trend.


And on that third hand, we continue to ship one loaded container for every two loaded containers we receive. So how good can exports really be? Over the long-term, this can't end well.

See Also:
Calculated Risk: LA area Port Traffic increases in March, Exports hit new record

Source Data:
Port of Long Beach: Statistics
Port of Los Angeles: Statistics
The X-12-ARIMA Seasonal Adjustment Program