

Click to enlarge.
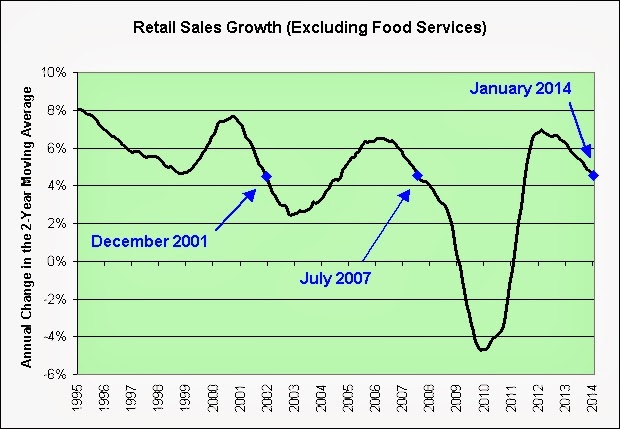
Good luck blaming the slow and steady growth rate decline (since 2012) on this winter's weather.
In May of 2012, I predicted that the next recession would hit on or before October 2014. Eight months to go. I see little reason to alter my opinion. At the rate we're going, it could be close enough for government work anyway. I truly hope I am wrong. Seriously.
If I am right (might not be of course), this is going to be a nasty recession. Why? Many seem to think a recession is impossible during ZIRP and that the Fed has saved us. What a confidence shaking wake-up call that would be.
I am especially amused by the party of 1999. Had we not thrown such a spectacular one (and hoarded for the Y2K bug that was a non-event), the recession may have happened right then and there. Praise be to celebratory can-kicking.
And lastly, rising interest rate environment my @$$.
This is not investment advice. As always, just ugly charts and opinions.
Source Data:
St. Louis Fed: Retail Sales: Total (Excluding Food Services)

8 comments:
Autos, Housing, Gov't deficit spending (the recent drivers of our economic growth) all looking weak to me.
For many, perhaps most, the recession never ended.
Real incomes for the majority suck and don't square with what I'd call a recovery.
mab,
Autos, Housing, Gov't deficit spending (the recent drivers of our economic growth) all looking weak to me.
It's just the whether!
Whether or not the "storm drains' profits?
Whether or not the "storm shutters" businesses?
Whether or not "storm troopers" can maintain peace if the @#$% hits the fan again?
When bad whether closes a storm door, it opens storm windows of opportunity.
Stormy whether is just part of life.
Mr Slippery,
Carl Weathers can make things a bit "Rocky 2."
Wall Street can't blame him though. As they say, "Creed is good."
I love your ugly graphs.
I think Mab is onto something.
Here's the key, I believe.
Sadly,
JzB
Mark,
Can you chart the derivative of that series? It would help in looking for the inflection points.
CP
Jazzbumpa,
Yeah. We just need to redine what labor is and then convince robots to shop at malls (served by robotic "labor" of course). That's all, lol. Sigh.
Gallows Cylon humor.
CP,
I see where you are going with this but I'm afraid to obfuscate the chart any further.
The 2-year moving average with a year over year delay already adds significant complexity and lag/delay. Real time it is not.
In order to do a rate of change chart on top of that I'd have to add even more complexity and delay. Put another way, I'd have to pick yet another time scale to do the rate of change justice.
That said, I think the eyeball does a fairly good job of seeing the changing slopes in the chart.
One thing that interests me is the 1995 to 1999 slope. Extrapolate it out and you pretty much hit the bottom in 2010. We better hope that isn't indicatve of what's yet to come (I seriously doubt it) or I'm not even remotely permabearish enough, lol. Sigh.
Post a Comment