

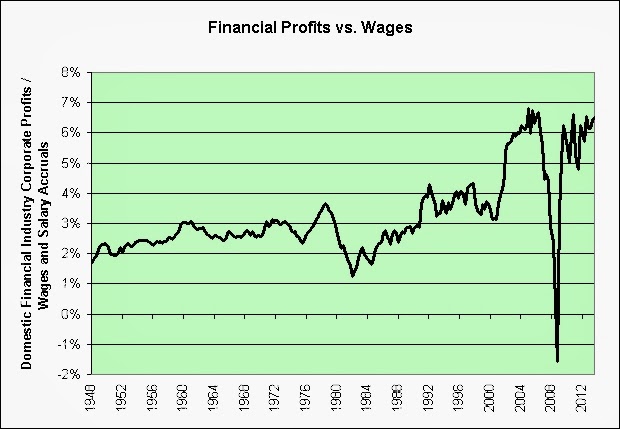
The first chart shows domestic financial industry corporate profits divided by overall wages and salary accruals.
Click to enlarge.
It's looking pretty good lately but let's really get into the details. And when I say pretty good, I mean that it isn't actually crashing again right now (even though it appears to be fully primed for another crash).
Three charts to go! The next chart shows the quarterly change.

Click to enlarge.
Note the increasing amplitude of the vibrations. In the next chart, let's just look at the absolute value of the quarterly change. This will give us the magnitude of the increasing chaos that is clearly evident in the system.

Click to enlarge.
In the next chart, let's look at the 5 year moving average of that absolute value and slap an exponential trend on it.

Click to enlarge.
Epic tank-slapper! Epic exponential trend failure! Epic system failure!
I will end with some good news and bad news.
First, the good news. The chaos appears to be receding.
Now, the bad news. Is it actually receding or does it just appear to be receding? Over the short-term? Over the long-term? Who knows! I have doubts. I believe that the tank-slapper is being managed with illusionary and unsustainable dampening. What we can't see yet, can't hurt us yet! It's the modern and financially innovative ostrich effect!
July/August 2009
This Year’s Battle over Mark-to-Market Versus Mark-to-Model Accounting Was Worth the Fight
FSP FAS 157-4 relates to determining fair values when there is no active market or where the prices being used represent distressed sales. It reaffirms that the objective of fair value measurement is to reflect how much an asset would be sold for in an orderly transaction (as opposed to a distressed or forced sale).
There's only one thing that determines value better than the free markets. That's a group of corporate executives tweeking financial models as they look to enhance the value of their stock options. Risk on, baby! Risk on!
Too bad we can't apply this same concept to home sellers. I know that you are only willing to pay $150,000 for this house but my economic model clearly shows that it is worth $300,000! You just need to be patient until the economy returns to its "orderly" peak again!
This post once again inspired by Rob Dawg's tank-slapper concept (as seen in the comments of previous posts). I went looking for an epic tank-slapper chart that could really do it justice today. Found one on my first attempt. I didn't even have to call a personal astrologer. Go frickin' figure.
Source Data:
St. Louis Fed: Custom Chart

2 comments:
As an engineer I've seen the video many times but never with the commentary.
The real lesson if you survive a tank slapper is to fix it.
Rob Dawg,
I have also seen the video quite a few times without commentary. In the 1970s, I remember seeing it on some sort of endless loop tape inside a cartridge of some kind. I don't think the player was capable of playing sound. We also watched quite a few educational sports videos on it too (always silent).
That's if memory serves of course. Been a long time!
The real lesson if you survive a tank slapper is to fix it.
Have no fear! Here's a glimpse of what Bernanke's helicopter might do over the long-term!
Chinook ground resonance - side
Oops. Bad example. ;)
Post a Comment