Showing posts with label housing. Show all posts

Wednesday, April 19, 2023

Wage Inflation Pressure

The following chart shows the natural log of U.S. wage and salary disbursements. When using natural logs, constant exponential growth is seen as a straight line.


The Fed does not need to deflate wages back into the long-term channel in green, but rather to return to the slope of that channel. What's done is done. Deflation to undo the high inflation is definitely not the goal.

Some progress is being made. We've noved from the steep slope of the red line to the more moderate slope of the yellow line.

I'm convinced that they can achieve their goal, one way or another. But at what cost? I can be a bit cynical, but there's a high risk here that we're still in the early stages of a no-win situation.

How high will the unemployment rate need to rise to get us back to the healthier wage inflation trend? I have no idea, but I can say with 100% certainty that 100% unemployment would do it. Can't have any wage and salary disbursements if nobody is working.

The bulk of my net worth sits in inflation-protected I-Bonds and TIPS. As of about a year ago, my IRA sits entirely in bonds without inflation protection (TLT). And here's where I sit until I see a reason to take on more risk. Near record unemployment expected to rise, falling house prices, and high interest rates are not things that make me excited about taking on riskier investments.

Not investment advice.

Thursday, November 10, 2022

Gimme Shelter

The following chart shows the natural log of the CPI for shelter. When using natural logs, constant exponential growth is seen as a straight line. I have added long-term trend lines in red.


With lofty housing prices and lofty mortgage rates, it seems very unlikely that we're going to make it back to the top of the trend channel anytime soon. Which, if you think about it, is kind of odd. I could swear that the Fed really wanted that. Just not all at once, apparently. Too bad.

If I were a gambling man, I would wager that there is more risk leaving the channel to the downside than to the upside. And maybe I am a gambling man, because I continue to hold TLT. Very encouraged by today's CPI report. One battle doesn't win the war though, of course.

Saturday, October 29, 2022

Massive Economic Uncertainty Continues

So many consumer surveys, but none of them ask the key questions for the next year:
- How much did you accumulate in savings during the pandemic?
- How much do you have left?
- How much of that do you intend to spend?
Without the answers, forecast margins of error are *massive.*


Twitter: Ian Shepherdson

Great questions. Too bad the Fed Chairman can't see the answers.

Saturday, October 22, 2022

Net Worth to Total Debt Ratio

The following chart shows household and nonprofit organization net worth divided by total debt in all sectors.


As seen using the red channel, this 60-year linear trend has failed by a large amount in the aftermath of the Great Recession. Epic failure, actually. Should have more of them. Never before has so much additional prosperity been generated by so little additional debt.

Of course, not everyone believes that fairy tales always have happy endings. Here's a scary fable involving bears that's just in time for Halloween.

Net worth has been falling rapidly lately, thanks to the stock and bond markets. We'd be back in the channel if it were to fall another 30% or so, assuming it were to continue to happen rather quickly. And what would be quicker than rapidly rising mortgage rates combined with million dollar homes?

Of course, there's another way to get back in the trend channel. Total credit market debt outstanding is only $91.2 trillion. Yes, only $91.2 trillion. A pittance, really. If we were to quickly increase it by 40% then back in the "safety" of the declining channel we would be. Think what we could do with all that free money! Here's an idea. A $36 trillion Halloween party in the name of world peace! Everyone on the planet could be invited. Nobody goes home empty handed. Woohoo!

Please don't confuse my love of gallows humor for sarcasm, nor my love of sarcasm for gallows humor. It's both. It's almost always both these days, lol. Sigh.

Monday, September 26, 2022

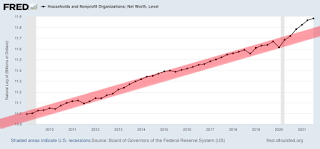
Household Net Worth

The following chart shows the natural log of household net worth. When using natural logs, constant exponential growth is seen as a straight line. I have added a long-term trend channel in red.


Friday, September 23, 2022

Metaverse Real Estate Gallows Humor

As seen in the image below, I just did an Internet search for "metaverse real estate prices" and I feel the need to share the results.


It's a rare treat to stumble upon such a rewarding gem. Do I keep searching? Do I read the two articles that I found? No, I'm good. I think my questions have been fully answered, lol.

This search was inspired by today's tweet from @MacroAlf:

Thoughts and prayers to people who took a mortgage to buy real estate in the Metaverse.

Mark Twain once said, "Buy land, they're not making it anymore." Too bad he's not still around to offer his thoughts on imaginary land, lol.

Wednesday, May 18, 2022

How Bad Could It Get?

The following chart shows the natural log of household and nonprofit net worth divided by the consumer price index. When using natural logs, constant exponential growth is seen as a straight line.

The future's so bright, I gotta wear shades night vision goggles.

Friday, January 28, 2022

Household Net Worth


Behold the household wealth creation of a pandemic combined with ZIRP. Broken window fallacies be damned. Break them, and break them good I say. It's a brand new era of unprecedented prosperity! And should this plan ever start to falter, look for plague, pestilence, and NIRP to save the day!!

Seriously. Other than recent bitcoin and stock market performance, there's absolutely no reason to fear downside risk or reversion towards the mean theories. Even in uncharted territory, the Fed always knows what it's doing. Always has your back!

I know I said I was serious in the last paragraph. It was gallows humor. Sorry about that. I actually just bought more I-Bonds. Not only do they track inflation as seen in the CPI, but they can never deflate. Not that many are all that worried about deflation again. Yet.

Sunday, May 2, 2021

The Cascading Exponential Trend Failures of Real GDP Growth

The headlines are dominated by talk of robust GDP growth during the recovery. Thought it might be a good time to offset that with a few charts of real GDP reality.

Here is a short-term chart of the natural log of real GDP. When using logarithms, constant exponential growth is seen as a straight line.


Note that, thanks to the virus, we failed to stay in the green channel. We're currently throwing everything at real GDP, including the kitchen sink, just in an attempt to get back to where we were. Also note that real GDP growth was weakening before the virus even hit. The Fed raised rates in 2017 and 2018. In 2019, the Fed was forced to backtrack on that plan. In hindsight, a rate of 2.4% was too draconian. The Fed ended the year at only 1.6%. And then, the virus hit.

So, in the short-term, we're definitely attempting to claw our way back to that green trend channel. But what about long-term?


The red channel is where we once were. That ship has sailed. No hope of ever getting back to it, especially now that we have a Covid baby bust. That exponential trend failed spectacularly, leaving us with a new green channel. The green channel then failed too. Cascading exponential trend failures. That's where we are now.

Here's the good news. We're all in this perma-ZIRP handbasket together and some of us strongly suspect where we are headed. Brush up on your Japanese and enjoy the ride! We might not like the ultimate destination all that much, but the path to get there is filled with easy money. And when I say easy money, I'm not expecting retired savers patiently waiting for interest rates to "normalize" to someday make out like bandits. This isn't a Hollywood movie. If anything, it's more like Gilligan's Island. Being stuck at zero is normal. Interest rates have been exponentially decaying for 40 years. It's just more of the same.

Saturday, April 17, 2021

Thoughts on Food, Services, Health, and the Economy

The following chart compares the annual percentage change in personal consumption expenditures of food and services.


Looking forward to a return to normal.

There are three reasons we spent more money on food since the pandemic started. First, we have more food stockpiled. Second, our food has been delivered. Third, we have not been as price conscious. Taking advantage of sales hasn't been nearly as important to us over the past year. All of these things will soon reverse once we are vaccinated.

There is a disturbing fourth reason that food expenditures are up for others.

March 11, 2021
One year later, a new wave of pandemic health concerns

Weight change is a common symptom when people are having difficulty coping with mental health challenges. A majority of adults (61%) reported experiencing undesired weight changes, since the start of the pandemic, with more than 2 in 5 (42%) saying they gained more weight than they intended. Of this group, adults reported gaining an average of 29 pounds (with a median gain of 15 pounds), and 1 in 10 (10%) said they gained more than 50 pounds. For the 18% of Americans who said they lost more weight than they wanted to, the average amount of weight lost was 26 pounds (median of 12 pounds).

50 pounds is a lot to gain in one year, and a surprisingly large number of people managed to do it. Ouch.

For what it is worth, I intentionally lost about 10 pounds. It wasn't from eating less. I chose to walk more. I've averaged 6.7 miles per day during the pandemic. Trying to make a permanent habit out of both walking and cycling. Bought a bicycle late last year and will soon be riding it again. I'm optimistic that even more weight will be lost this summer.

I'm more optimistic in general. I do think inflation will be transitory. I do think interest rates will remain low. If true, I'm not even that concerned about debt. I don't currently see a stock market bubble or a housing bubble (although I do see pockets of great excess). Like Japan, it won't be a great era for savers, but that's okay. There are worse things than ZIRP. Not expecting the roaring twenties, but perhaps the meowing twenties? Could that be a thing?

I'm basing my optimism on a reversion to the mean, or lack thereof. We are continually told that when interest rates normalize, blah, blah, blah. I am arguing that rates have been normalized. They've been decaying exponentially for 40 years. That's what has been normal. Unless someone can give me a good reason why rates will soon stop decaying then I'm going to continue to believe that they will continue to decay. More money deposited in banks certainly won't lead to higher interest rates. Any counterargument based purely on excess money makes no sense to me at all. And man, has there ever been more excess money than right now?

This is not investment advice. My optimism is tempered. A friendly reminder that this is still an Illusion of Prosperity blog. The meowing twenties could easily become the hissing thirties. Sustainable and stable is not the long-term path we find ourselves on. Each economic crisis has been worse than the last.

Tuesday, March 9, 2021

The Road to NIRP Is Paved with ZIRP Intentions

The following table shows the annualized inflation rate in the 2 years before each recent recession, the inflation rate in the 2 years after each recent recession, and the differences between them.


I am not a believer in the economy will soon overheat theory. A $1.9 trillion stimulus package might sound like a shockingly large sum of money, but let's put this in perspective. Household net worth now stands at $123 trillion and has grown $63 trillion since the Great Recession in 2009. By comparison, $1.9 trillion is like loose change found in the couch.

Our exponentially growing monetary addiction requires ever increasing sums just so the wheels don't fall off. Has anyone actually considered that $1.9 trillion might not be enough?

Ten Rhetorical Stimulus Questions

1. Are we supposed to be shock and awed by a $1.9 trillion stimulus package that's only equivalent to 1.5% of household net worth?
2. What if savers continue to save?
3. Are we counting on savers to spend?
4. Are we counting on spenders to spend what they've already spent?
5. How does one hoard services?
6. If there really is pent-up demand for haircuts, will people be getting twice as many over the next 2 years?
7. How much of a $1400 stimulus check would we need to save to earn $4.20 in annual interest in an online savings account that only has a 0.3% interest rate?
8. Should we use the $1400 instead to buy 100+ fast food meals, 2 shares of Tesla @ $674, or 5 shares of GameStop @ $247?
9. Easy come, easy go. Am I right?
10. Human sacrifice? Dogs and cats living together? Mass hysteria?


Humans needlessly sacrificed, dogs and cats living together, mass hysteria. It's been quite a year.

Sunday, February 28, 2021

TV Show Idea: Soap Bubble

The following chart shows nonresidential construction employees divided by residential construction employees.


With record low housing inventory, record low mortgage rates, a Fed committed to ZIRP for the foreseeable future, and a potential permanent increase in working from home, an acceleration of the downward trend in the chart seems inevitable to me.

Will history repeat? Will 2010 to 2027 play out exactly like 1990 to 2007? Will our next financial crisis be another housing bubble disaster? Will the Fed step in to save the economy with even more ZIRP in 2027? Will long-term Treasury yields continue to temporarily scream higher in a futile effort to resist the overwhelming long-term deflationary forces?

Tune in next week for another exciting episode of Soap Bubble!

Saturday, February 27, 2021

The Lords of Land

The following chart shows the rental income of persons with capital consumption adjustment divided by wage and salary disbursements.


We can't all be the lords of land. At some point, there would be a landlord glut. Might already be there.

Sunday, February 21, 2021

The 30 Trillion Dollar Elephant in the Room

The following chart shows household and nonprofit debt. I have added an exponential trend line in red based on the data from 1952 to 2007.


We are now $30 trillion below the consumer debt trend that was in place for 55 years. Ben Bernanke once said that credit is the lifeblood of our economy. The lifeblood is certainly not pumping like it once did. Is it any wonder that Janet Yellen is practically begging for more fiscal stimulus?

While others talk of an economy that will soon temporarily overheat, I ponder what this elephant's continuing long-term impact on real GDP growth will be and if yet another elephant will appear in a post-pandemic world.

See no elephants, hear no elephants, speak no elephants.

Source Data:
St. Louis Fed: Households and Nonprofit Organizations; Debt Securities and Loans; Liability, Level

Wednesday, February 17, 2021

3.2%

The following chart shows the natural log of the 30-year Treasury yield. On a log chart, exponential growth (or decay)) is seen as a straight line.


If the long-term exponential decay of the 30-year Treasury bond yield (in red) continues, then the current rise in the yield should max out at no more than roughly 3.2%.

As seen in the yellow line, the long-term trend (in red) and the short-term trend (in green) meet at about 1.17.

e1.17 = 3.2

Declaring that the long-term bull market in long-term Treasuries is over while the natural log of the yield is well below the red trend line seems more than a bit premature to me. Where's the evidence of the bull market's demise?

So, now we wait. Will the line in the sand hold at 3.2%? I think it will but I wouldn't bet my life on it. If it does not hold, things are going to get very interesting. And when I say interesting, I actually mean terrifying. I don't think that our increasingly leveraged consumer society would know how to cope with mortgage rates that no longer fall over the long-term.

Our increasingly leveraged consumer society isn't a bug. It's a feature. It's buy design. (Pun intended.)

Saturday, February 13, 2021

During Pandemic, Millionaire Regrets Not Having More Money

Here’s the latest from The Onion. They often go over the top with the satire, but they almost always crack me up.

February 11, 2021
Millionaire who bought a home at 26 regrets paying off his mortgage early: 'This is the biggest downside no one tells you'

After being mortgage-free, my and wife and I lived comfortably off the severance checks that we negotiated when we quit our six-figure jobs in finance (by that time, we had amassed a net worth of $3 million), and the $150,000 in annual passive income — mostly from real estate, dividend stocks and bonds.

But my entire attitude slowly changed once I sent that final mortgage check. I stopped aggressively looking for new freelance consulting work. I went from taking on three contracts per month to just one. So instead of working 60 hours, I was only working 20 hours. At around $10,000 per contract, I was losing out on $20,000 of monthly income.


Oops. My bad. It's not The Onion. It's CNBC.

Wednesday, February 3, 2021

Addicted to Rising Debt and Falling Interest Rates


This chart shows the 10-year Treasury bond yield compared to the inverse of our economy’s total debt securities and loans. It is not a coincidence that they are clearly highly correlated. They are our two linked financial addictions. Our debt is growing exponentially as our interest rates decay exponentially. Can’t really have one without the other.

In theory, our debt can approach infinity if and only if interest rates approach zero. This keeps our “what do you want your payments to be” economy in balance for business, home, and auto loans.

In practice, Japan’s debt is approaching infinity as their interest rates remain zero. We’re following their lead.

For two decades, we’ve been listening to the experts talk of normalizing interest rates. My reaction remains the same. Interest rates are normalized. They’ve been normalized for 40 years. As our debt goes up, interest rates must come down. If interest rates don’t eventually come down, the economy collapses.

We all know this. The whole world knows this. Just imagine what a 6%+ yield on the 10-year Treasury bond would currently do to the housing market. Housing would implode. We saw a yield this high in 2000. 2000 is over though. It’s 2021 and our debt is so much higher now. Can’t live in the past.

For those worried about inflation, we’re so addicted to debt that 4% Treasury yields should be more than enough for a major deflationary event, especially with the stock market’s current level of exuberance and so many people parsing every word out of Powell’s mouth for any signs of tightening.

The party can continue as long as debt rises to stimulate this economy and interest rates fall to stimulate this economy. Don’t think of our economy as a patient in the intensive care unit. Think of it instead as an addict with stimulants in both hands. Over the long-term, this can’t end well. It has has worked for 40 years so far though, so good luck betting on the timing. In the meantime, stimulated life goes on.

Sunday, January 24, 2021

World War ZIRP

This chart shows money with zero maturity as a fraction of GDP.

1. Over the long-term, I fully expect to see this ratio continue to climb. We know that MZM will continue to climb. The only real question is how fast GDP climbs relative to it. Over the short-term (Q3 2020), GDP is currently winning, as some parts of our economy are rebounding from the pandemic. Over the long-term, I don’t think GDP has any hope of winning though. It’s competing with, in Ben Bernanke’s words, "a technology, called a printing press, that allows it to produce as many dollars as it wishes at essentially no cost."

2. Will more dollars mean more consumer price inflation? Over the short-term, maybe. Pent-up demand may need to work through the system. Over the long-term, I doubt it. And when I say long-term, I only mean in my lifetime. And I’m getting old.

3. As seen in the chart, the rising interest rate problem of the 1970s wasn’t due to too many dollars relative to GDP. Quite the contrary. Those expecting a return to the 1970s need to understand this. I can sympathize with the theory, since I do have stagflationary in my name. However, banks only pay higher interest when they need to attract more deposits. Banks are not charities. Expecting banks to pay much higher interest rates when they are already flooded with money makes little sense to me.

4. Flooding banks with money isn’t just happening in the United States. It’s happening all over the world. As a saver, other than a modest investment in savings bonds each year, there’s nowhere relatively safe left to hide. Think of it as a monetary pandemic. The first outbreak was in Japan. None of us were immune. We’re all infected now. There is no cure. It is way too late for monetary vaccinations.

5. So, cash is trash. Right?  Not so fast. It is my belief that the monetary leaders of every country know that we are all spending above our means. No monetary leader wants the inevitable collapse to happen on their watch. There’s no way out for them either. So, what do they need in order to delay the eventual outcome? ZIRP and low inflation. In theory, ZIRP allows nearly infinite borrowing for everyone at essentially no cost, especially for loans that have interest only payments. Low inflation stops people from hoarding goods. Need both, just like Japan. That’s the only solution there seems to be. When in a hole, dig deeper. A deeper hole is a horrible solution for future generations, of course.

6. Will we see 40 year mortgages in my lifetime? Yes. We’ve seen the duration of auto loans increase. Why not loans on homes? Anything is possible in a world with century bonds. Pretend and extend!

7. I kind of joke. 40-year mortgages are already available. I’m still alive. Yes!

8. This is why I have embraced interest rate sensitive utilities, even as some believe that utilities are in a bubble. If I’m wrong on interest rates, then I’ll be wrong on utilities. It mostly comes down to where interest rates are headed over the next decade or so. I’m sleeping okay since the decision to buy utilities in December. At the very least, ignorance is bliss.

9. Anyone who knows with certainty where we are headed is a fool. We’ve never been in this situation before. Historical data isn’t much more useful than tea leaves. That’s especially true of historical data before we fell off the gold standard. What should the P/E of the stock market be in a world potentially trapped in ZIRP long-term? Perhaps we’ll find out in hindsight. After all, today’s data is tomorrow’s historical data. And so on.

Wednesday, January 13, 2021

Interest on Short-Term Money

The following is a chart of the weighted average interest rate earned on the interest bearing components included in the MZM (money of zero maturity).


This series was discontinued in the summer of 2019. Unless someone can convince me that our easy money housing market can tolerate higher interest rates, or that stimulus money flooding into banks means that banks will offer higher interest rates to attract even more money, I offer a potentially suitable alternative for this series going forward.


It's Japanese. It's a Zero. Easy to remember. No chart necessary.

Sunday, January 3, 2021

My Asset Allocation


My IRA may have recently filled with the Vanguard Utilities ETF (VPU), but it is not the majority of my nest egg. Want to make that clear. I also want to repeat that I am definitely not offering investment advice on this blog. I’m just showing what I am doing. As you can see, not much of a risk taker in retirement. Things might look different if I had a job to fall back on.

These are ballpark numbers. I’m valuing the long-term TIPS based on their inflationary gains from when I bought them many years ago, and not on their current market value (which is considerably higher). One small bond matures this month (1.17% real yield), a large bond matures in 8 years (1.75% real yield), and the rest mature in about 20 years (2.13% real yield).

The savings bonds are mostly I-Bonds also earning an average weighted real yield of about 2%. There are some EE-Bonds as well, which are guaranteed to double if held 20 years. The earliest purchases in 2010 are halfway there.

The savings account is earning 0.3%, thanks to the pandemic and the relentless long-term decline in interest rates.

I’m basing the value of my home on current Zillow estimates. Subject to change during the next earthquake. I do live in the Seattle area. This downside risk to my nest egg is not trivial.