


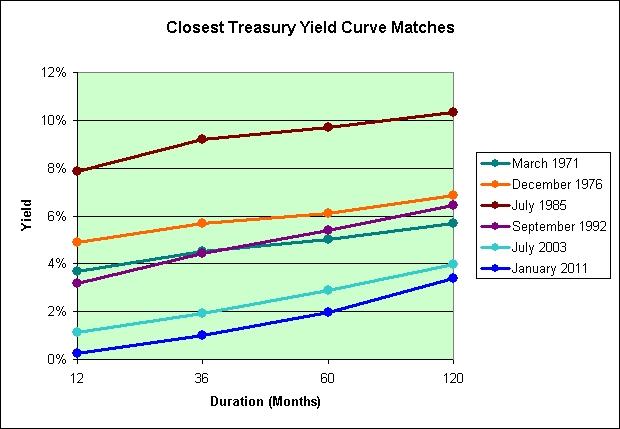
Here's a chart of the closest matches. The blue line shows the current yields. Note the similarity in the shapes of the curves.
The following chart shows what the CPI might do over the next 3 years if all goes according to plan. The three most recent matches saw inflation rise by roughly 3% per year over the period. The 1970s saw more.

This last chart shows what interest rates might do over the next 3 years if all goes according to plan. The short end of the curve is where most of the action would likely be. In two of the five periods the yield on the 10-year treasury actually fell.

This assumes that all goes according to plan though. It might. It might not. I tend to think that we'll see smaller increases in the CPI and smaller increases in interest rates. This is mostly based on what I think might happen in China. Time will tell.
Remember, this is a military operation. Nothing ever goes according to plan. - Ludwig Beck, Valkyrie (2008)
I remain a reluctant short-term deflationist who has most of his net worth in inflation protected treasury bonds and inflation protected I-Bonds. That pretty much shows you my level of conviction. Over the long-term I expect to see higher inflation and/or slower growth.
Source Data:
FRB: Historical Interest Rates
US Treasury: Daily Treasury Yield Curve Rates

6 comments:
Here's one reason I am a "reluctant" deflationist.
UK inflation is spinning out of control
December’s inflation number wasn’t just bad, it was horrific. In just one month the headline CPI rate went up from 3.3 to 3.7 percent. The retail prices index now stands at 4.8 per cent.
It could happen here. I would not rule it out.
Be sure to check out Mish's Point of No Return article today.
Here's a teaser.
Stockman, who described himself as a libertarian during a recent interview with Reason.tv, told Raw Story that the economy got into this mess because of the public and private sectors' addiction to "guns and butter Keynesianism," an economic policy that amounts to a Ponzi scheme that has ballooned since 1990.
Nice comparison of yield curves.
With all the monetization, CPI could take off some time in the next few years. I doubt the Fed hikes short rates, though, due to the impossibility of rolling the trillions short term US debt without further monitezation. Catch-22.
The US is not in the same position as it was in the 70s. We can't hike rates to 20% and ride them down. It would BK the treasury.
There. Is. No. Way. Out.
Mr Slippery,
We can't hike rates to 20% and ride them down. It would BK the treasury.
It is my thinking that China will be forced to do the work for us. I'm assuming that they will choose lower food prices over a billion hungry and enraged citizens.
Just a simple theory though. There are far too many variables and control knobs. A much more complex theory is needed, but unfortunately the more complex the theory the more likely it will be completely useless.
What we *really* need is solid research from Nobel prize winning economists with a background in Long-Term Capital Management. Yes sir. That would solve all of our problems, lol. Sigh.
I remember reading a funny anecdote about LTCM and how their model might have worked better if they had used more than 10 years of data. Doh!
Macro stuff is very complex and things could spin off in a many directions. But a large interest rate hike would surely crush the feeble housing market and would probably double the interest payments on the debt. I think about 75% of treasury debt is due in <5 years, but I need to go find the actual numbers.
Mr Slippery,
MONTHLY STATEMENT OF THE PUBLIC DEBT
OF THE UNITED STATES
Bills: $1.8 trillion
Notes: $5.6 trillion
Bonds: $0.9 trillion
TIPS: $0.6 trillion
There's not much sitting in long-term bonds.
TIPS and Bills would be the hardest to inflate away. It could be done through taxation though. It would just require a higher inflation rate. Sigh.
Post a Comment